
Projecting Rookies: The Top 30 for 2026-27
The thirty rookies our model likes most for 2026-27, the categories they actually supply, four verdicts, where two public top-300 lists disagree with us, and an honest account of what the model gets wrong.
A rookie is projected by a different model from everybody else, because the model that handles established players works from a man's own NHL seasons and a rookie does not have any. Here that means a player with fewer than 25 career NHL games, which is the league's own rookie line, and at least one measurable season in a league we can translate. What the model works from instead, and how far to trust it, is below the table.
The top thirty
| # | Player | Club | Pos | Pts | GP | Middle half | SOG | Hits | Blocks | FOW | PIM | Most recent season |
|---|---|---|---|---|---|---|---|---|---|---|---|---|
| 1 | Gavin McKenna | TOR | L | 53 | 81 | 45 to 60 | 200 | 47 | 28 | 16 | 46 | NCAA 51 in 35 |
| 2 | Roman Kantserov | CHI | R | 52 | 81 | 44 to 59 | 221 | 69 | 34 | 16 | 39 | KHL 64 in 63 |
| 3 | Porter Martone | PHI | R | 46 | 81 | 38 to 53 | 209 | 115 | 28 | 16 | 60 | NCAA 50 in 35 |
| 4 | Anton Frondell | CHI | C | 41 | 81 | 33 to 48 | 228 | 50 | 56 | 593 | 21 | SHL 28 in 43 |
| 5 | Caleb Desnoyers | UTA | C | 37 | 65 | 31 to 43 | 97 | 111 | 32 | 234 | 29 | QMJHL 78 in 45 |
| 6 | James Hagens | BOS | L | 37 | 67 | 31 to 43 | 147 | 64 | 23 | 9 | 27 | NCAA 47 in 34 |
| 7 | Ivar Stenberg | SJS | L | 36 | 66 | 30 to 42 | 121 | 56 | 23 | 9 | 15 | SHL 33 in 43 |
| 8 | Jake O'Brien | SEA | C | 33 | 67 | 27 to 39 | 71 | 88 | 34 | 240 | 24 | OHL 93 in 53 |
| 9 | Tij Iginla | UTA | C | 32 | 62 | 26 to 37 | 125 | 83 | 28 | 222 | 28 | WHL 90 in 48 |
| 10 | Caleb Malhotra | VAN | C | 32 | 67 | 26 to 38 | 62 | 110 | 34 | 240 | 29 | OHL 84 in 67 |
| 11 | Konsta Helenius | BUF | C | 28 | 67 | 22 to 34 | 100 | 71 | 28 | 240 | 21 | AHL 63 in 63 |
| 12 | Carter Yakemchuk | OTT | D | 26 | 68 | 20 to 32 | 91 | 58 | 77 | 0 | 28 | AHL 40 in 54 |
| 13 | Cole Hutson | WSH | D | 25 | 68 | 18 to 31 | 100 | 82 | 63 | 0 | 36 | NCAA 32 in 35 |
| 14 | Bradly Nadeau | CAR | L | 24 | 56 | 19 to 29 | 84 | 75 | 24 | 8 | 15 | NCAA 46 in 37 |
| 15 | Daxon Rudolph | BUF | D | 22 | 48 | 17 to 26 | 49 | 49 | 42 | 0 | 23 | WHL 78 in 68 |
| 16 | Brady Martin | NSH | C | 22 | 51 | 17 to 26 | 70 | 112 | 26 | 183 | 34 | OHL 24 in 24 |
| 17 | Sandis Vilmanis | FLA | L | 21 | 67 | 15 to 27 | 65 | 117 | 21 | 9 | 15 | J20 32 in 40 |
| 18 | Joakim Kemell | NSH | C | 20 | 67 | 14 to 26 | 68 | 126 | 36 | 240 | 35 | AHL 29 in 48 |
| 19 | David Reinbacher | MTL | D | 19 | 51 | 14 to 23 | 49 | 41 | 48 | 0 | 33 | AHL 24 in 57 |
| 20 | Trevor Connelly | VGK | L | 19 | 43 | 15 to 23 | 66 | 29 | 17 | 6 | 13 | AHL 49 in 46 |
| 21 | Alberts Smits | NYR | D | 19 | 51 | 14 to 23 | 63 | 33 | 45 | 0 | 15 | Liiga 13 in 38 |
| 22 | Chase Reid | SEA | D | 19 | 51 | 14 to 23 | 56 | 38 | 45 | 0 | 18 | OHL 48 in 45 |
| 23 | Michael Brandsegg-Nygård | DET | R | 19 | 56 | 14 to 24 | 77 | 121 | 18 | 8 | 20 | SHL 11 in 42 |
| 24 | Roger McQueen | ANA | C | 18 | 47 | 14 to 22 | 68 | 104 | 24 | 168 | 27 | NCAA 27 in 36 |
| 25 | Sacha Boisvert | CHI | C | 17 | 56 | 12 to 22 | 47 | 115 | 28 | 201 | 29 | NCAA 17 in 26 |
| 26 | Boston Buckberger | CBJ | D | 17 | 68 | 10 to 23 | 68 | 60 | 78 | 0 | 24 | NCAA 29 in 43 |
| 27 | Michael Hage | MTL | C | 17 | 36 | 14 to 20 | 44 | 37 | 18 | 129 | 11 | NCAA 52 in 39 |
| 28 | Adam Jiricek | STL | D | 17 | 51 | 12 to 21 | 48 | 35 | 45 | 0 | 17 | OHL 59 in 55 |
| 29 | Cayden Lindstrom | CBJ | C | 17 | 52 | 12 to 22 | 58 | 115 | 26 | 186 | 58 | NCAA 10 in 31 |
| 30 | Carson Carels | CGY | D | 16 | 40 | 12 to 20 | 43 | 42 | 35 | 0 | 19 | WHL 73 in 58 |
Points and games are for an 84-game season. The middle half is part of the projection rather than decoration: Gavin McKenna's 53 sits inside a band of 45 to 60, and half of all rookies land outside their own band. Anyone quoting a rookie number to a decimal place, ours included, is presenting a centre of mass as a forecast.
Read the bands as wider for the short seasons. 11 of these 30 were measured over fewer than 40 games, most of them college players whose season is about 35. The band comes from how wrong the model has been in general, not from how much evidence stands behind this particular player, so for those 11 it is the floor of the uncertainty and not the whole of it.
Four verdicts
Roman Kantserov, take. Second in the class at 52 points, and one of only two players here we rank above both public lists. He has no average draft position at all, meaning he goes undrafted in most rooms. He is the only man in our top ten who has already produced against professionals: 64 points in 63 KHL games. The model rewards exactly that, and it costs a late pick to find out whether it should.
Anton Frondell, take in any league that counts faceoffs. 41 points is fair and unremarkable. The 593 faceoff wins are not. He is the only rookie in the league projected for a first-line centre's draw volume, and faceoffs are the category managers patch in the last two rounds and then never fix. At an average draft position of 139 that is a category solved cheaply. The caveat is that the whole thing rests on him opening the season as a top-six centre in Chicago; move him to the wing and the number that makes him interesting disappears.
Cole Hutson, probably let somebody else pay. Both lists have him around 167 to 185. The draft room takes him 90. We have him 349, which is further out than either, and we should be honest that being the extreme opinion is not the same as being right. The optimistic end of his band is 31 points. What the disagreement is really about is that a rookie defenceman on a second pair and a second power-play unit holds a genuine NHL job without being a top-hundred fantasy asset, and the 77 picks between the analysts and the market suggest nobody is confident about which he is.
Porter Martone, pay only if you believe the role. Every chart including ours has him on Philadelphia's first line and first power-play unit, and both lists rank him around 91 to 97 while we have him 162. There is no argument about deployment left, only about what a twenty year old does with it in year one. If you think a first-line rookie scores like a first-liner, the price is fair. Our model applies a year-one discount, and that is the single assumption most likely to be wrong if this class outperforms.
Where the public lists disagree with us
| Player | Our rank | Beebs and Bondy | Larkin | ADP |
|---|---|---|---|---|
| Porter Martone | 162 | 91 | 97 | 70 |
| Gavin McKenna | 126 | 108 | 109 | 95 |
| Anton Frondell | 189 | 147 | 143 | 139 |
| Cole Hutson | 349 | 167 | 185 | 90 |
| Roman Kantserov | 133 | 171 | 217 | not drafted |
| Ivar Stenberg | 226 | 189 | 172 | 141 |
| James Hagens | 220 | 258 | 290 | 114 |
| Caleb Desnoyers | 219 | not listed | on the bubble | - |
| Tij Iginla | 272 | not listed | 293 | - |
| Konsta Helenius | 316 | not listed | 203 | - |
| Carter Yakemchuk | 339 | not listed | on the bubble | - |
| Bradly Nadeau | 360 | not listed | on the bubble | - |
| Brady Martin | 386 | not listed | on the bubble | - |
These two lists are not independent of each other. Both are published at Daily Faceoff, and analysts at the same outlet read the same sources and often each other. Where they agree and we do not, that is worth something, but it is one house's view against ours rather than two, and an earlier version of this article called them independent and drew a stronger conclusion from the agreement than it had earned.
Three readings, with that caveat attached.
The lists agree with each other more closely than either agrees with us. Gavin McKenna 108 and 109, Porter Martone 91 and 97, Anton Frondell 147 and 143. When two rankings land within six places of each other and we are sixty behind them, the burden is on us. That gap is the year-one discount, and it is the model's most consequential assumption.
On Hutson the market is the outlier, not the analysts. Both lists put him around 175. The draft room takes him at 90. Our 349 is further out still, but the interesting disagreement is the 77 picks between the analysts and the people actually drafting.
We like Roman Kantserov and James Hagens more than both lists do. Those are the two names where our model is making a claim nobody else is making, which makes them the cheapest tests of whether it knows anything.
What this class looks like
| League | Players | Position | Players |
|---|---|---|---|
| NCAA | 10 | Centre | 12 |
| OHL | 5 | Defence | 9 |
| AHL | 5 | Left wing | 6 |
| SHL | 3 | Right wing | 3 |
| WHL | 3 | ||
| KHL | 1 | ||
| QMJHL | 1 | ||
| J20 | 1 | ||
| Liiga | 1 |
The NCAA is the largest single supplier, a third of the list, ahead of the American league and clear of any junior league. That is a change in how players arrive and it has the practical consequence noted above: college seasons are short, so a third of this list is projected off about 35 games.
Nine of the thirty are defencemen, who rarely feature in rookie conversation and who supply blocks in volume. 3 of them project for more than sixty blocks, and the rest of the list supplies almost none.
Where this list is too generous
The honest weakness of the set is not the top. It is how many players it lets into the league at all.
| Season | Rookies, 20+ games | 40+ games | 70+ games | 30+ points | 40+ points | Top scorer |
|---|---|---|---|---|---|---|
| 2022-23 | 31 | 18 | 7 | 6 | 4 | 74 |
| 2023-24 | 32 | 17 | 6 | 5 | 2 | 61 |
| 2024-25 | 25 | 13 | 4 | 4 | 3 | 63 |
| 2025-26 | 40 | 25 | 11 | 6 | 2 | 60 |
| Four-season average | 32 | 18 | 7 | 5.2 | 2.8 |
Against those four seasons, we project 4 rookies at forty points or more, 10 at thirty or more and 18 at twenty or more. The top of the points column is close to the record and the middle of it is not: 4 against an average of 2.8 is defensible, 10 against 5.2 is roughly double. The games columns are further out still. We project 162 rookies for twenty or more games against a four-season average of 32, and 78 for forty or more against 18.
The diagnosis is specific. On opening night we dress 36 rookies across the league, and that number is about right against a four-season average of 32 who go on to play twenty games. Only 20 of them come from the table above, which is worth sitting with: ten of our top thirty are projected for games they have not yet won. The other 126 men projected for twenty games or more are being handed call-up time, and the model spreads that time thinly across everyone plausible instead of concentrating it on the few who will actually get it. Real seasons concentrate: a club loses a centre and one prospect plays fifty games while ten others play none.
So read the games column as an expectation and not a plan. It is right about the pool and wrong about the individual, which matters most in the lower half of this list and hardly at all in the top ten, where the games come from a depth-chart slot rather than from a probability.
At the other end the model is too conservative, and for a reason worth stating. Our highest number is 53. The last four seasons produced leading rookie scorers of 74, 61, 63 and 60. The realised leader is the best of about 32 attempts and a projection is the centre of one, so the two are not the same quantity. Drafting for upside means reading the top of the band.
How the model works
Four inputs, in the order they are used, and then a worked example that reproduces the table above.
1. What he did, converted to NHL currency
Every league gets a factor: points per game times the factor gives an NHL-equivalent rate.
| League | Factor | League | Factor |
|---|---|---|---|
| KHL | 0.77 | NCAA | 0.41 |
| SHL | 0.59 | Allsvenskan | 0.38 |
| Swiss NL | 0.55 | Slovakia | 0.35 |
| Liiga | 0.54 | VHL, Mestis | 0.30 |
| Czechia | 0.52 | OHL, WHL, QMJHL | 0.28 |
| AHL | 0.44 | USHL, USNTDP | 0.24 |
| DEL | 0.42 | J20, MHL | 0.18 |
Rates are carried internally per 82 games, which is a unit and not an assumption: the 84-game season enters through games played, not through the rate. A first-line forward is projected for 81 games this year rather than 79 for exactly that reason.
The AHL factor has the most evidence behind it, fitted across 247 paired minor-to-NHL seasons. The junior factors rest on smaller samples and are hedged toward the published literature rather than taken at face value.
2. The translation is pulled toward the middle
The higher a translated rate goes, the less of it survives contact with the NHL.
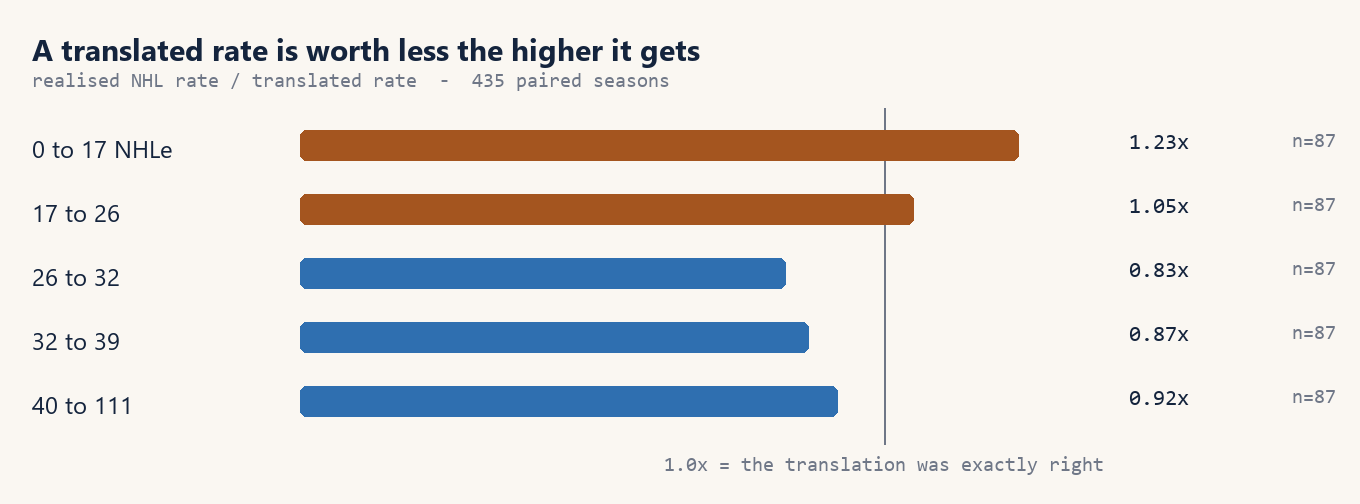
A prospect translating to a modest rate tends to beat it; one translating to a big rate tends to fall short. That is regression to the mean, and it is why a single year-one multiplier cannot work: whatever number you choose is wrong at one end. The model uses a slope instead.
3. Where he was drafted
The draft-slot prior is a lookup table, and this is what is in it. The first column is the number the model actually applies. The second is the same quantity rebuilt from our own records: the median points per 82 that players drafted in each range scored in their first NHL season of 20 or more games, taken within three years of their draft.
| Where he was drafted | The model's prior | Measured in our records | Players |
|---|---|---|---|
| 1 to 5 | 58.4 | 43.6 | 59 |
| 6 to 10 | 43.0 | 31.5 | 53 |
| 11 to 20 | 34.5 | 24.9 | 80 |
| 21 to 45 | 32.6 | 23.6 | 102 |
| 46 to 90 | 28.3 | 23.1 | 58 |
| 91 or later | 24.5 | 24.3 | 66 |
Those two columns should agree and they do not. The prior is documented as having been measured this way, and it cannot be reproduced from the data we hold: it runs ten to fifteen points high in every bucket, and no variation of the join gets closer. Both are printed because the alternative is repeating a provenance we cannot stand behind.
How much this matters depends on which part of the number is wrong. A constant offset does not matter at all, because the prior is a regressor with a fitted coefficient and an intercept sitting beside it, and the fit absorbs the level. What it cannot absorb is the shape. The prior spreads a top-five pick and a late pick by 33.9 points; measured, that spread is 19.3. Multiplied through the coefficient of 0.421, the model is giving a top-five pick roughly 6 points more than our own records support, and five of the top ten above are top-five picks.
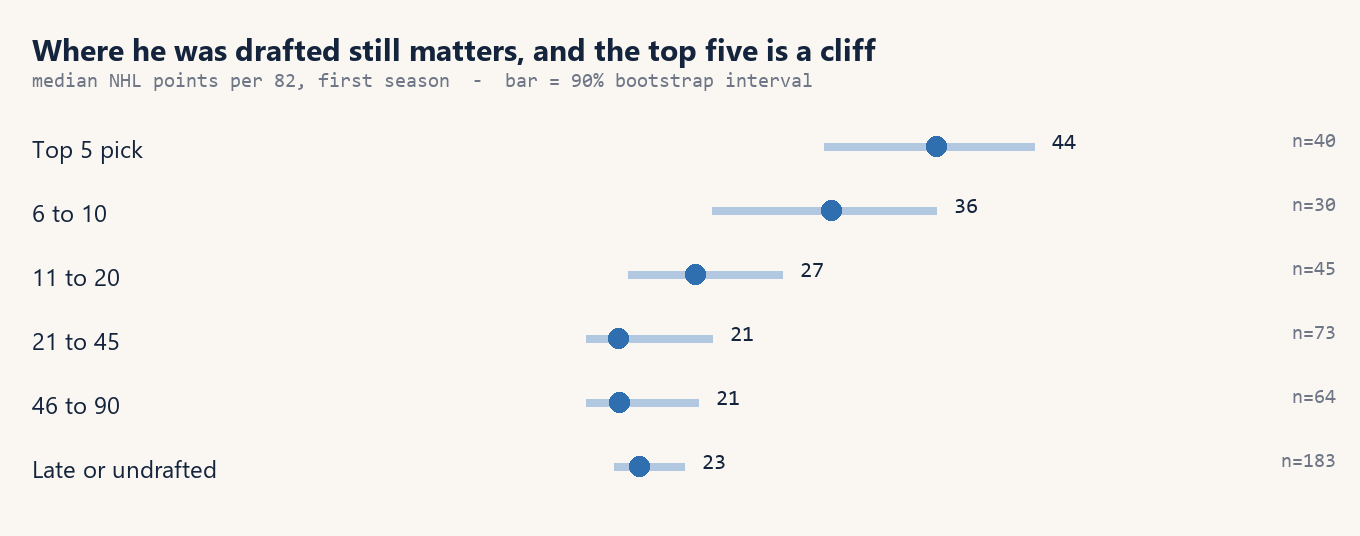
The shape is not in doubt even if the size is. The top five is a cliff rather than the top of a slope, and by the eleventh pick most of the signal has gone; the measured column agrees about that and puts the flat part earlier. Medians rather than means throughout, because the means are dragged up by the handful of stars in each bucket and the typical outcome is what a projection wants.
Note what the table is conditional on: he played twenty NHL games. It says what he scores if he holds a job, which is the quantity that pairs with the games model in step four, and the two must not both carry the survivorship or it gets counted twice.
This is not simply that better prospects score more. The effect is measured with the translated rate already in the model, so it is a comparison among players who produced comparably in their own leagues. Two men who translated to the same NHL-equivalent rate, one taken third and one taken sixtieth, did not go on to do the same thing. What draft slot adds is what scouts and clubs paid to find out, which at eighteen carries information that a points total in a junior league does not.
4. How his club will use him
A player already on a depth chart keeps his role's games. Everyone else gets the probability he holds an NHL job at all, times the games he would play if he did. This is the step that produces the generosity described above.
The most useful evidence here is a short call-up, and it is easy to read backwards:
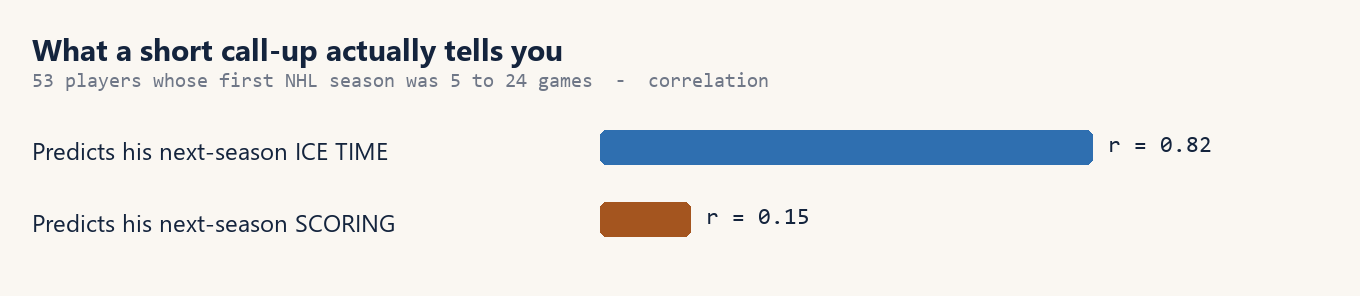
Nine games at seventeen minutes tells you almost exactly what role a coach will give a player next season and almost nothing about what he will score with it. So the minutes from a cameo go into the model and the points do not, which is the reverse of what a box score invites you to do.
The formula, and a worked example
Putting the first three together:
points per 82 = -4.83 + 0.688 x NHLe per 82 + 0.421 x draft-slot prior
and then points = rate per 82 x games / 82, with games from step four. Nothing else. Every number in the first three columns below is in this article, so the table can be recomputed by hand:
| Player | Most recent season | Per game | Factor | NHLe per 82 | Pick | Prior | Rate per 82 | GP | Points |
|---|---|---|---|---|---|---|---|---|---|
| Gavin McKenna | NCAA 51 in 35 | 1.457 | 0.41 | 49.0 | 1 | 58.4 | 53.5 | 81 | 53 |
| Roman Kantserov | KHL 64 in 63 | 1.016 | 0.77 | 64.1 | 44 | 32.6 | 53.0 | 81 | 52 |
| Porter Martone | NCAA 50 in 35 | 1.429 | 0.41 | 48.0 | 6 | 43.0 | 46.3 | 81 | 46 |
| Anton Frondell | SHL 28 in 43 | 0.651 | 0.59 | 31.5 | 3 | 58.4 | 41.4 | 81 | 41 |
| Caleb Desnoyers | QMJHL 78 in 45 | 1.733 | 0.28 | 39.8 | 4 | 58.4 | 47.1 | 65 | 37 |
| James Hagens | NCAA 47 in 34 | 1.382 | 0.41 | 46.5 | 7 | 43.0 | 45.2 | 67 | 37 |
| Ivar Stenberg | SHL 33 in 43 | 0.767 | 0.59 | 37.1 | 2 | 58.4 | 45.3 | 66 | 36 |
| Jake O'Brien | OHL 93 in 53 | 1.755 | 0.28 | 40.3 | 8 | 43.0 | 41.0 | 67 | 33 |
| Tij Iginla | WHL 90 in 48 | 1.875 | 0.28 | 43.1 | 6 | 43.0 | 42.9 | 62 | 32 |
| Caleb Malhotra | OHL 84 in 67 | 1.254 | 0.28 | 28.8 | 3 | 58.4 | 39.6 | 67 | 32 |
| Konsta Helenius | AHL 63 in 63 | 1.000 | 0.44 | 36.1 | 14 | 34.5 | 34.5 | 67 | 28 |
| Carter Yakemchuk | AHL 40 in 54 | 0.741 | 0.44 | 26.7 | 7 | 43.0 | 31.7 | 68 | 26 |
The last column is what this arithmetic produces and it matches the published projection for 12 of these 12 players to within a point. Take Gavin McKenna: 51 points in 35 NCAA games is 1.457 a game, times 0.41 times 82 is 49.0 per 82. He went 1 overall, so his prior is 58.4. Then -4.83 + 0.688 x 49.0 + 0.421 x 58.4 = 53.5 per 82, over 81 games, is 53.
The categories nobody projects
Most rookie projections apply one number per position for hits, blocks and shots, and one number is badly wrong: a bottom-six forward hits more than twice as often as a top-six one. The model uses measured per-game rates cut by position and minutes, blended with a published scouting projection and the player's own junior record.
| Role | Hits | Blocks | Shots | PIM | Draws |
|---|---|---|---|---|---|
| Centre, top six | 0.63 | 0.58 | 2.35 | 0.40 | 14.69 |
| Centre, middle | 0.92 | 0.51 | 1.48 | 0.36 | 11.50 |
| Centre, bottom | 1.42 | 0.50 | 1.00 | 0.40 | 7.18 |
| Winger, top six | 0.70 | 0.43 | 2.59 | 0.36 | 0.43 |
| Winger, middle | 0.87 | 0.44 | 1.92 | 0.36 | 0.33 |
| Winger, bottom | 1.38 | 0.39 | 1.11 | 0.40 | 0.28 |
| Defence, first pair | 0.76 | 1.48 | 1.39 | 0.44 | 0.00 |
| Defence, second pair | 1.11 | 1.15 | 0.88 | 0.46 | 0.00 |
| Defence, third pair | 0.70 | 0.88 | 0.63 | 0.29 | 0.00 |
Where a player has no measurable peripheral history at all, these cells and a scouting report are the whole of it. A junior league that does not record hits or blocks leaves nothing to blend, so the projection is the role's rate adjusted by what scouts say about how he plays, and the penalty minutes he did record. That is a weaker basis than a measured rate and it is worth knowing which of the two you are reading: a defenceman projected for exactly the third-pair block rate has no block history behind him.
The faceoff cells count only men who take faceoffs. A player listed at centre who takes fewer than three draws a game is being used on the wing, and averaging him into the centre cells dragged the bottom one to 4.71 draws a game, which is not a real fourth-line centre. Filtered to actual draw-takers it is 7.18 and the middle cell moves to 11.50. The filter applies to centres only, because the contamination runs one way: men listed at centre and used on the wing, not the reverse. Applied to wingers it selected the handful of converted centres and reported a top-six winger at 4.59 draws a game against a true 0.43.
How wrong it usually is
Fitted on 435 paired seasons and scored only on players held out of the fit:
| What the model uses | Average error | Correlation |
|---|---|---|
| The translation alone, no model | 9.77 | 0.633 |
| Translation and age | 9.27 | 0.678 |
| Translation and league indicators | 9.34 | 0.671 |
| Translation and draft slot | 9.24 | 0.680 |
Read that carefully, because the honest conclusion is weaker than it looks. The bottom three are separated by a tenth of a point of error across 435 players, which is inside the noise. What the numbers support is that adding age or league does not clearly help, not that leaving them out is decisively better. Draft slot is used because it is the simplest of the three and no worse. All four beat doing nothing, and that is the finding with weight behind it.
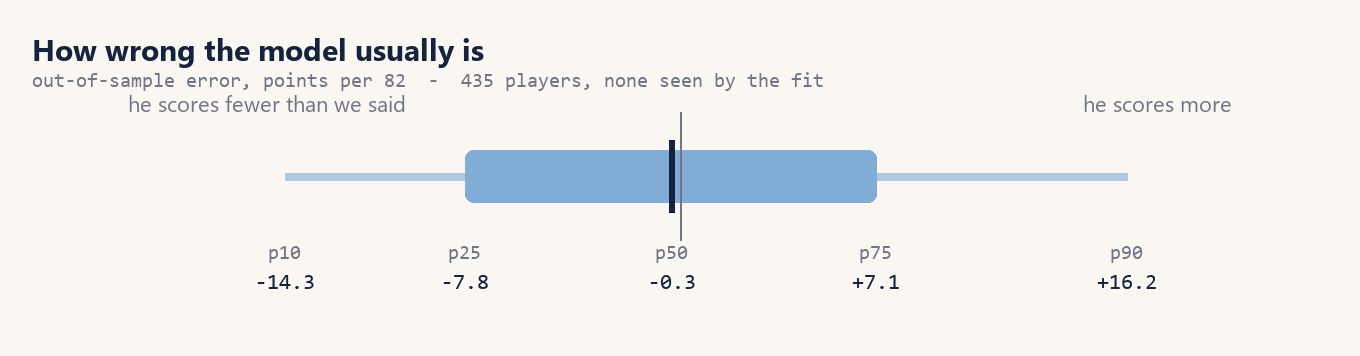
Half of all rookies land within about seven points per 82 of their projection either way. One in ten comes in fourteen below, one in ten sixteen above. That is the honest width of a rookie number and it is why every player above carries a band.
What the model does not know
One rookie a season scores 60 or more, and nothing here will tell you which. Covered above: our highest number is 53 and the last four leaders were 74, 61, 63 and 60. Read the top of the band.
Age looked like a real effect and was mostly staleness. An earlier version of this model found older prospects performing worse at the same translated rate, strongly enough to look like genuine ageing. It was an artefact of which seasons we held. Players whose last recorded season was in the USHL had a median of six years between it and their NHL debut, against one year for everyone else, purely because their college seasons had never been ingested. The model was reading out-of-date evidence and calling it age. Restricting pairs to a prospect season within two years of the debut removed the effect entirely. It is a good example of a variable that is significant, interpretable, and wrong.
A missing season does not look like a missing season. Two players in an earlier draft of this list were projected off nothing at all, because the seasons behind them had never been ingested: one had three years of NCAA hockey the model could not see, another a full American-league season. Neither produced an obvious error. They produced slightly generous numbers off a positional average, and both moved when the real seasons arrived. Everyone in the table above now has a measurable season behind him, and there is a check on the pipeline that refuses to let a rookie be ranked without one.
Games move these numbers as much as talent does. Several players above are separated by five or six points purely because one is drawn onto a second line and another onto a third, and a change to a depth chart moves a projection without any new information about the player. When a club's lines were corrected during this article's life, one man left the top thirty entirely and ten rows moved. If you disagree with a club's depth chart, you disagree with the projection, and that is usually the more productive argument to have.
Projections are for the 2026-27 season, which runs 84 games. Junior, college and minor lines are the player's most recent measurable season. Paired seasons come from our own prospect records matched to the same player's subsequent NHL seasons, limited to first seasons of 20 or more NHL games so a brief call-up cannot set a rate, and to prospect seasons within two years of that debut. Public ranks are from Beebs and Bondy's and Matt Larkin's top 300 lists at Daily Faceoff; average draft position and depth-chart slots are from Daily Faceoff.