
Rate Risers: the twenty biggest projected points-per-game gains for 2026-27
The twenty biggest scoring-rate risers for 2026-27
Not who gains the most points. Who is projected to be the most improved player when he is actually on the ice, measured in points per game, with the line, the power-play unit, the linemates and the departures behind each one. Everybody here is projected at 0.6 points a game or better, so this is a list of players worth drafting rather than a list of large percentages.
Why per game and not per season
Rank the same projections on total points gained and you do not get a list of improving players. You get a list of players who were hurt. Availability swamps everything: on that ranking 74% of the movement comes from playing more games rather than from playing better, and 13 of the twenty missed at least a quarter of last season. The top of it is Matthew Tkachuk (+45), Pierre-Luc Dubois (+33) and Victor Hedman (+30), three men whose projections are largely a bet that they stay healthy.
Useful, but a different question. This list divides by games played first, so a man who misses twenty games and a man who plays all of them are compared on the same terms:
> gain = projected points per game, minus last season's points per game
Then, because a rate nobody is on the ice for wins no leagues, every entry also carries the counting consequence, split into the part that comes from more games and the part that comes from the better rate. Those two add back to the total points gained exactly.
10 of these twenty are also projected for more games than they played last season, and the median total gain across them is 12 points. The 2026-27 season is 84 games rather than 82, which is worth about two points to a point-per-game player, so read the totals with that in mind. It does not touch the per-game column, which is the point of using it.
The ten biggest rate risers
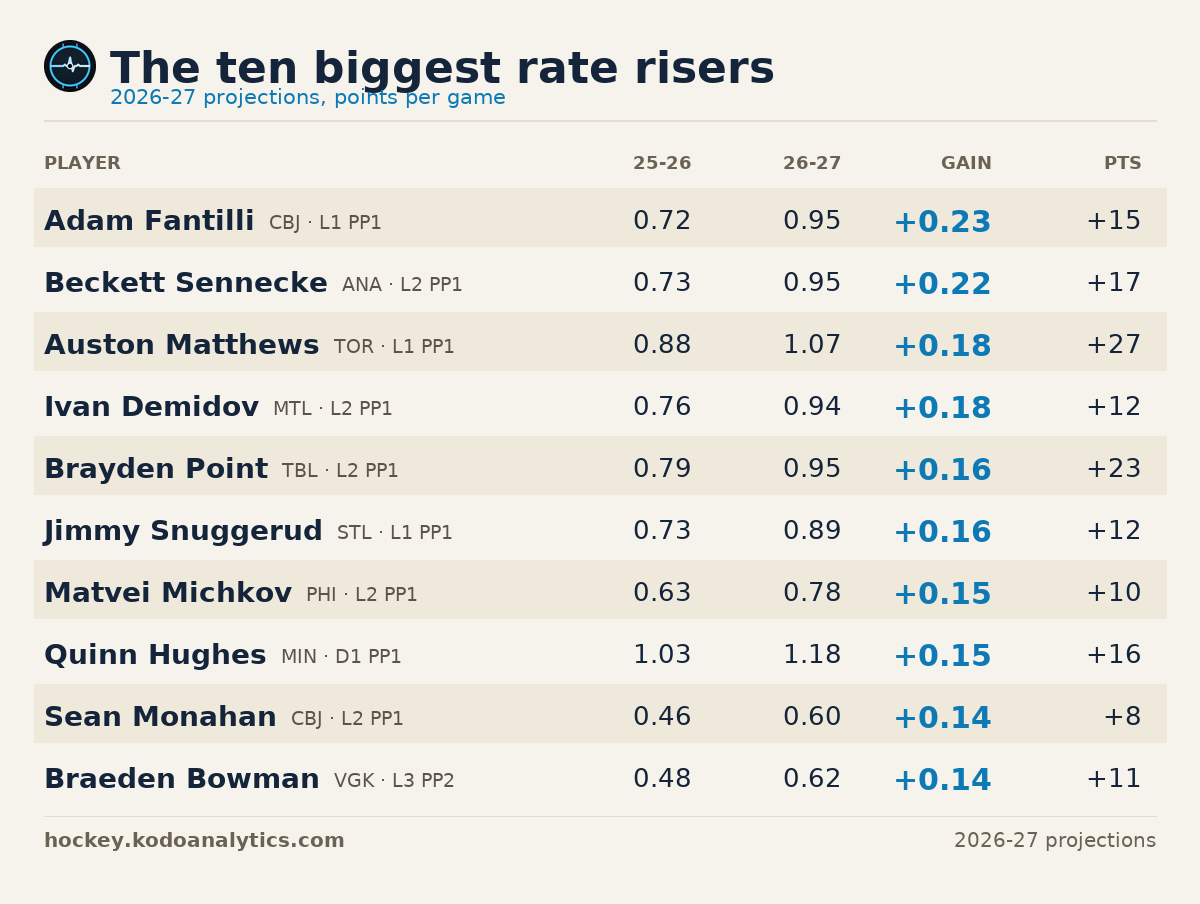
| # | Player | Team | Pos | 2025-26 P/GP | 2026-27 P/GP | Gain | Points | From games | From rate |
|---|---|---|---|---|---|---|---|---|---|
| 1 | Adam Fantilli | CBJ | C | 0.72 (59 in 82) | 0.95 (74 in 78) | +0.23 | +15 | -3 | +18 |
| 2 | Beckett Sennecke | ANA | R | 0.73 (60 in 82) | 0.95 (77 in 81) | +0.22 | +17 | -1 | +18 |
| 3 | Auston Matthews | TOR | C | 0.88 (53 in 60) | 1.07 (80 in 75) | +0.18 | +27 | +13 | +14 |
| 4 | Ivan Demidov | MTL | R | 0.76 (62 in 82) | 0.94 (74 in 79) | +0.18 | +12 | -2 | +14 |
| 5 | Brayden Point | TBL | C | 0.79 (50 in 63) | 0.95 (73 in 77) | +0.16 | +23 | +11 | +12 |
| 6 | Jimmy Snuggerud | STL | R | 0.73 (51 in 70) | 0.89 (63 in 71) | +0.16 | +12 | +1 | +11 |
| 7 | Matvei Michkov | PHI | R | 0.63 (51 in 81) | 0.78 (61 in 78) | +0.15 | +10 | -2 | +12 |
| 8 | Quinn Hughes | MIN | D | 1.03 (76 in 74) | 1.18 (92 in 78) | +0.15 | +16 | +4 | +12 |
| 9 | Sean Monahan | CBJ | C | 0.46 (36 in 78) | 0.60 (44 in 73) | +0.14 | +8 | -2 | +10 |
| 10 | Braeden Bowman | VGK | R | 0.48 (26 in 54) | 0.62 (37 in 59) | +0.14 | +11 | +2 | +8 |
Eleven to twenty
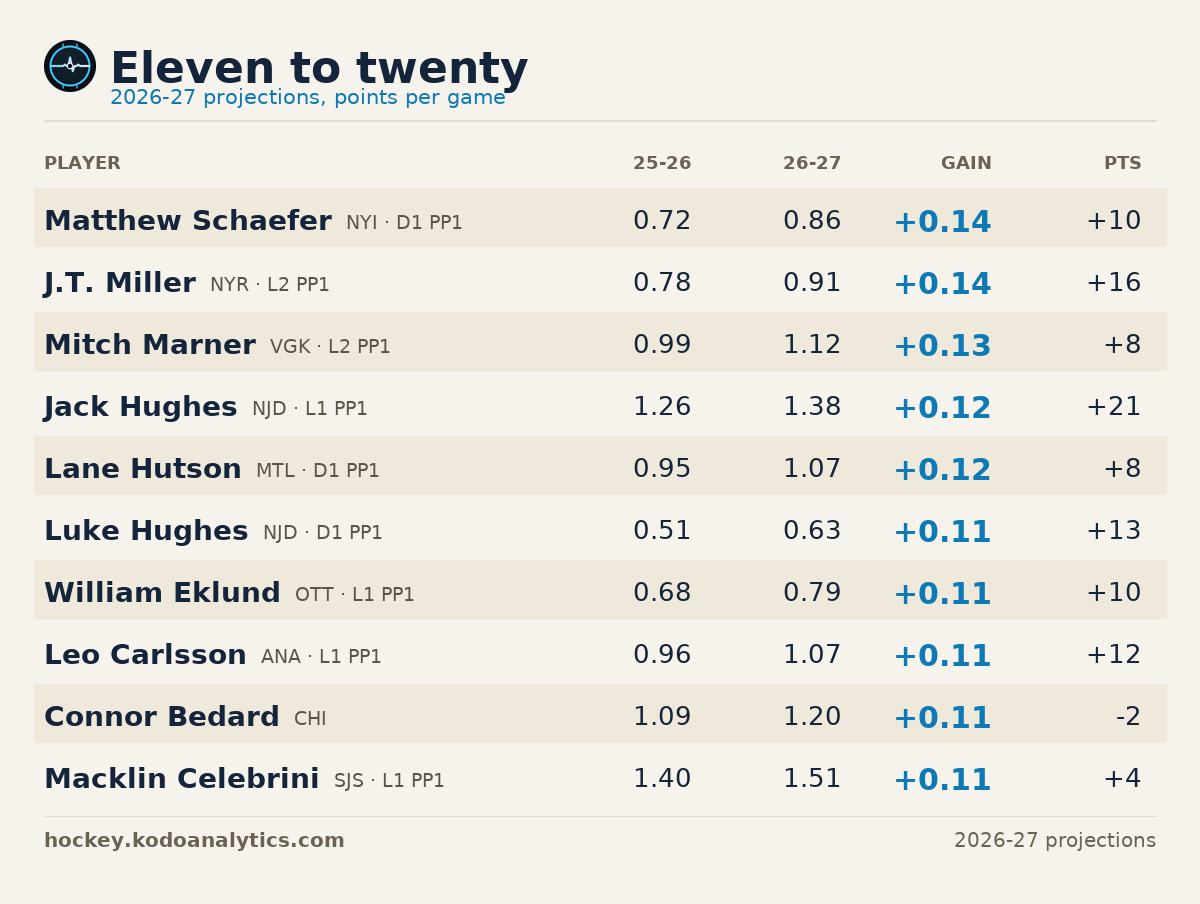
| # | Player | Team | Pos | 2025-26 P/GP | 2026-27 P/GP | Gain | Points | From games | From rate |
|---|---|---|---|---|---|---|---|---|---|
| 11 | Matthew Schaefer | NYI | D | 0.72 (59 in 82) | 0.86 (69 in 81) | +0.14 | +10 | -1 | +11 |
| 12 | J.T. Miller | NYR | C | 0.78 (53 in 68) | 0.91 (69 in 75) | +0.14 | +16 | +5 | +10 |
| 13 | Mitch Marner | VGK | R | 0.99 (80 in 81) | 1.12 (88 in 79) | +0.13 | +8 | -2 | +10 |
| 14 | Jack Hughes | NJD | C | 1.26 (77 in 61) | 1.38 (98 in 71) | +0.12 | +21 | +13 | +8 |
| 15 | Lane Hutson | MTL | D | 0.95 (78 in 82) | 1.07 (86 in 81) | +0.12 | +8 | -1 | +9 |
| 16 | Luke Hughes | NJD | D | 0.51 (35 in 68) | 0.63 (48 in 76) | +0.11 | +13 | +4 | +9 |
| 17 | William Eklund | OTT | L | 0.68 (53 in 78) | 0.79 (63 in 79) | +0.11 | +10 | +1 | +9 |
| 18 | Leo Carlsson | ANA | C | 0.96 (67 in 70) | 1.07 (79 in 74) | +0.11 | +12 | +4 | +8 |
| 19 | Connor Bedard | CHI | C | 1.09 (75 in 69) | 1.20 (73 in 61) | +0.11 | -2 | -9 | +7 |
| 20 | Macklin Celebrini | SJS | C | 1.40 (115 in 82) | 1.51 (120 in 79) | +0.11 | +4 | -4 | +9 |
Just outside: Jordan Kyrou (+0.11), Elias Pettersson (+0.11), Mason McTavish (+0.11), Dylan Strome (+0.10), Jesper Bratt (+0.10).
Two floors, and both of them matter. Nobody is here who is not projected at 0.6 points a game or better, which is about a 50-point pace over a full 84-game season. Improvement on its own is not the question a manager is asking: a fourth-liner going from 0.18 a game to 0.35 has improved by 94% and is still not on anybody's roster. The floor is on where he arrives, not on how far he travelled.
And what the forty-game gate costs. A rate is only as good as the games underneath it, so nobody with fewer than forty games last season is eligible: at twenty-five games an "improvement" is mostly noise in the baseline. On a twenty-game cut the list would also contain Victor Hedman (33 games last season, 0.52 to 0.69). Judge that for yourself; the gate is where the ordering stops moving, not a claim that those men will not improve.
Why each of them
Each entry carries the projected job from our depth chart, the projected linemates, the men he actually spent his even-strength minutes with last season, his ice time, his production quarter by quarter, and who has left the room.
On that last line, one caution that applies to all twenty and is the easiest thing here to over-read. We measured what clubs actually do with departed production, and they replace it. The minutes and the shots go to somebody, usually several somebodies, and the man who inherits an empty power-play seat is not handed the whole of it. The projections already price this in. A departure is a reason the door is open, not a licence to add the missing points to the nearest name.
1. Adam Fantilli, CBJ
0.72 points a game last season, 0.95 projected: a gain of +0.23. In totals that is 59 in 82 games to 74 in 78: +15 points, +18 of it from the rate and -3 from the change in games played.
The depth chart has him first-line centre and the first power-play unit. His projected linemates are Valeri Nichushkin and Kirill Marchenko. The unit adds Sean Monahan, Zach Werenski and Kent Johnson, with Kirill Marchenko carried over from his line.
He played 18:54 a night last season, 16:10 at even strength and 2:36 on the power play, and his most common even-strength partners were Kirill Marchenko (845 minutes), Ivan Provorov (532 minutes) and Zach Werenski (518 minutes).
Power-play points: 13 last season, 15 projected.
| Last season | Q1 | Q2 | Q3 | Q4 |
|---|---|---|---|---|
| Games | 20 | 21 | 21 | 20 |
| Points | 13 | 13 | 18 | 15 |
| Per game | 0.65 | 0.62 | 0.86 | 0.75 |
| Ice time | 17:10 | 20:03 | 18:52 | 19:29 |
Out of the room: Mason Marchment (45 points, 7 of them on the power play, 2.3 power-play minutes a night) has gone to SJS. Also gone: Boone Jenner (38p, 0.8 PP minutes).
2. Beckett Sennecke, ANA
0.73 points a game last season, 0.95 projected: a gain of +0.22. In totals that is 60 in 82 games to 77 in 81: +17 points, +18 of it from the rate and -1 from the change in games played.
The depth chart has him second-line and the first power-play unit. His projected linemates are Alex Killorn and Mikael Granlund. The unit adds Jackson LaCombe, Cutter Gauthier and Leo Carlsson, with Mikael Granlund carried over from his line.
He played 17:27 a night last season, 15:04 at even strength and 2:21 on the power play, and his most common even-strength partners were Mason McTavish (582 minutes), Jackson LaCombe (468 minutes) and Jacob Trouba (438 minutes).
Power-play points: 13 last season, 19 projected.
| Last season | Q1 | Q2 | Q3 | Q4 |
|---|---|---|---|---|
| Games | 20 | 21 | 21 | 20 |
| Points | 14 | 17 | 20 | 9 |
| Per game | 0.70 | 0.81 | 0.95 | 0.45 |
| Ice time | 16:36 | 16:56 | 19:04 | 17:08 |
Out of the room: John Carlson (60 points, 14 of them on the power play, 2.7 power-play minutes a night) has gone to TBL. Also gone: Mason McTavish (41p, 2.0 PP minutes) and Jacob Trouba (35p, 0.7 PP minutes).
3. Auston Matthews, TOR
0.88 points a game last season, 1.07 projected: a gain of +0.18. In totals that is 53 in 60 games to 80 in 75: +27 points, +14 of it from the rate and +13 from the change in games played.
The depth chart has him first-line centre, the first power-play unit and the penalty kill. His projected linemates are Matthew Knies and Gavin McKenna. The unit adds John Tavares, William Nylander and Darren Raddysh, with Matthew Knies carried over from his line.
He played 20:48 a night last season, 16:52 at even strength and 2:46 on the power play, and his most common even-strength partners were Max Domi (452 minutes), Matthew Knies (433 minutes) and Jake McCabe (425 minutes).
Power-play points: 12 last season, 21 projected.
| Last season | Q1 | Q2 | Q3 | Q4 |
|---|---|---|---|---|
| Games | 15 | 15 | 15 | 15 |
| Points | 12 | 11 | 19 | 11 |
| Per game | 0.80 | 0.73 | 1.27 | 0.73 |
| Ice time | 21:54 | 19:53 | 20:59 | 20:27 |
Out of the room: Matias Maccelli (39 points, 8 of them on the power play, 1.7 power-play minutes a night) has gone to NYI. Also gone: Nick Robertson (32p, 1.1 PP minutes).
4. Ivan Demidov, MTL
0.76 points a game last season, 0.94 projected: a gain of +0.18. In totals that is 62 in 82 games to 74 in 79: +12 points, +14 of it from the rate and -2 from the change in games played.
The depth chart has him second-line left wing and the first power-play unit. His projected linemates are Alex Newhook and Oliver Kapanen. The rest of that unit is Nick Suzuki, Cole Caufield, Lane Hutson and Juraj Slafkovský.
He played 15:30 a night last season, 12:28 at even strength and 3:01 on the power play, and his most common even-strength partners were Oliver Kapanen (762 minutes), Lane Hutson (444 minutes) and Juraj Slafkovský (424 minutes).
Power-play points: 20 last season, 25 projected.
| Last season | Q1 | Q2 | Q3 | Q4 |
|---|---|---|---|---|
| Games | 20 | 21 | 21 | 20 |
| Points | 15 | 20 | 13 | 14 |
| Per game | 0.75 | 0.95 | 0.62 | 0.70 |
| Ice time | 14:30 | 15:48 | 15:38 | 16:02 |
Out of the room: Brendan Gallagher (23 points, 5 of them on the power play, 1.4 power-play minutes a night) has gone to VAN.
5. Brayden Point, TBL
0.79 points a game last season, 0.95 projected: a gain of +0.16. In totals that is 50 in 63 games to 73 in 77: +23 points, +12 of it from the rate and +11 from the change in games played.
The depth chart has him second-line centre and the first power-play unit. His projected linemates are Jake Guentzel and Gage Goncalves. The unit adds Victor Hedman, Nikita Kucherov and Brandon Hagel, with Jake Guentzel carried over from his line.
He played 18:16 a night last season, 14:27 at even strength and 3:47 on the power play, and his most common even-strength partners were Nikita Kucherov (508 minutes), Jake Guentzel (505 minutes) and J.J. Moser (352 minutes).
Power-play points: 11 last season, 21 projected.
| Last season | Q1 | Q2 | Q3 | Q4 |
|---|---|---|---|---|
| Games | 16 | 16 | 15 | 16 |
| Points | 9 | 13 | 21 | 7 |
| Per game | 0.56 | 0.81 | 1.40 | 0.44 |
| Ice time | 19:11 | 18:10 | 17:15 | 18:22 |
Out of the room: Darren Raddysh (70 points, 26 of them on the power play, 3.7 power-play minutes a night) has gone to TOR. Also gone: Oliver Bjorkstrand (32p, 3.1 PP minutes) and Corey Perry (37p, 2.3 PP minutes).
6. Jimmy Snuggerud, STL
0.73 points a game last season, 0.89 projected: a gain of +0.16. In totals that is 51 in 70 games to 63 in 71: +12 points, +11 of it from the rate and +1 from the change in games played.
The depth chart has him first-line right wing and the first power-play unit. His projected linemates are Robert Thomas and Dylan Holloway. The unit adds Pavel Buchnevich, Logan Mailloux and Mason McTavish, with Robert Thomas carried over from his line.
He played 16:42 a night last season, 14:26 at even strength and 2:16 on the power play, and his most common even-strength partners were Robert Thomas (428 minutes), Philip Broberg (383 minutes) and Colton Parayko (343 minutes).
Power-play points: 9 last season, 14 projected.
| Last season | Q1 | Q2 | Q3 | Q4 |
|---|---|---|---|---|
| Games | 18 | 17 | 17 | 18 |
| Points | 10 | 5 | 17 | 19 |
| Per game | 0.56 | 0.29 | 1.00 | 1.06 |
| Ice time | 15:33 | 15:41 | 17:21 | 18:11 |
Out of the room: Jordan Kyrou (46 points, 14 of them on the power play, 2.2 power-play minutes a night) has gone to WSH. Also gone: Jonathan Drouin (24p, 2.8 PP minutes).
7. Matvei Michkov, PHI
0.63 points a game last season, 0.78 projected: a gain of +0.15. In totals that is 51 in 81 games to 61 in 78: +10 points, +12 of it from the rate and -2 from the change in games played.
The depth chart has him second-line left wing and the first power-play unit. His projected linemates are Owen Tippett and Noah Cates. The rest of that unit is Travis Konecny, Trevor Zegras, Jamie Drysdale and Porter Martone.
He played 14:50 a night last season, 12:39 at even strength and 2:11 on the power play, and his most common even-strength partners were Noah Cates (424 minutes), Jamie Drysdale (354 minutes) and Bobby Brink (335 minutes).
Power-play points: 12 last season, 16 projected.
| Last season | Q1 | Q2 | Q3 | Q4 |
|---|---|---|---|---|
| Games | 20 | 20 | 21 | 20 |
| Points | 10 | 13 | 9 | 19 |
| Per game | 0.50 | 0.65 | 0.43 | 0.95 |
| Ice time | 14:53 | 14:12 | 15:11 | 15:05 |
Out of the room: nobody of consequence. The largest departure is Emil Andrae at 13 points.
8. Quinn Hughes, MIN
1.03 points a game last season, 1.18 projected: a gain of +0.15. In totals that is 76 in 74 games to 92 in 78: +16 points, +12 of it from the rate and +4 from the change in games played.
The depth chart has him first pair on the left side and the first power-play unit. His projected partner is Brock Faber. The unit adds Joel Eriksson Ek, Kirill Kaprizov and Matt Boldy, with Brock Faber carried over from his line.
He played 27:44 a night last season, 23:28 at even strength and 4:10 on the power play, and his most common even-strength partners were Brock Faber (829 minutes), Kirill Kaprizov (498 minutes) and Ryan Hartman (389 minutes).
Power-play points: 34 last season, 38 projected.
| Last season | Q1 | Q2 | Q3 | Q4 |
|---|---|---|---|---|
| Games | 18 | 19 | 19 | 18 |
| Points | 21 | 14 | 26 | 15 |
| Per game | 1.17 | 0.74 | 1.37 | 0.83 |
| Ice time | 27:14 | 27:30 | 28:31 | 27:41 |
Out of the room: Mats Zuccarello (54 points, 21 of them on the power play, 3.6 power-play minutes a night) has gone to LAK. Also gone: Vladimir Tarasenko (47p, 2.3 PP minutes) and Marcus Johansson (49p, 1.3 PP minutes).
9. Sean Monahan, CBJ
0.46 points a game last season, 0.60 projected: a gain of +0.14. In totals that is 36 in 78 games to 44 in 73: +8 points, +10 of it from the rate and -2 from the change in games played.
The depth chart has him second-line centre, the first power-play unit and the penalty kill. His projected linemates are Conor Garland and Cole Sillinger. The rest of that unit is Zach Werenski, Kirill Marchenko, Kent Johnson and Adam Fantilli.
He played 17:08 a night last season, 13:30 at even strength and 1:56 on the power play, and his most common even-strength partners were Kent Johnson (468 minutes), Zach Werenski (390 minutes) and Ivan Provorov (367 minutes).
Power-play points: 10 last season, 12 projected.
| Last season | Q1 | Q2 | Q3 | Q4 |
|---|---|---|---|---|
| Games | 20 | 19 | 19 | 20 |
| Points | 9 | 13 | 8 | 6 |
| Per game | 0.45 | 0.68 | 0.42 | 0.30 |
| Ice time | 18:19 | 17:57 | 16:18 | 15:56 |
Out of the room: Mason Marchment (45 points, 7 of them on the power play, 2.3 power-play minutes a night) has gone to SJS. Also gone: Boone Jenner (38p, 0.8 PP minutes).
10. Braeden Bowman, VGK
0.48 points a game last season, 0.62 projected: a gain of +0.14. In totals that is 26 in 54 games to 37 in 59: +11 points, +8 of it from the rate and +2 from the change in games played.
The depth chart has him third-line right wing and the second power-play unit. His projected linemates are Tomas Hertl and Victor Olofsson. The unit adds William Karlsson, Noah Hanifin and Rasmus Andersson, with Victor Olofsson carried over from his line.
He played 14:08 a night last season, 12:50 at even strength and 1:18 on the power play, and his most common even-strength partners were Ivan Barbashev (312 minutes), Jack Eichel (288 minutes) and Noah Hanifin (245 minutes).
Power-play points: 4 last season, 6 projected.
| Last season | Q1 | Q2 | Q3 | Q4 |
|---|---|---|---|---|
| Games | 14 | 13 | 13 | 14 |
| Points | 10 | 4 | 6 | 6 |
| Per game | 0.71 | 0.31 | 0.46 | 0.43 |
| Ice time | 16:17 | 12:40 | 13:00 | 14:24 |
Out of the room: Pavel Dorofeyev (64 points, 30 of them on the power play, 3.4 power-play minutes a night) has gone to NYR. Also gone: Reilly Smith (26p, 0.4 PP minutes).
11. Matthew Schaefer, NYI
0.72 points a game last season, 0.86 projected: a gain of +0.14. In totals that is 59 in 82 games to 69 in 81: +10 points, +11 of it from the rate and -1 from the change in games played.
The depth chart has him first pair on the left side and the first power-play unit. His projected partner is Ryan Pulock. The rest of that unit is Brayden Schenn, Bo Horvat, Mathew Barzal and Calum Ritchie.
He played 24:41 a night last season, 20:17 at even strength and 3:19 on the power play, and his most common even-strength partners were Ryan Pulock (838 minutes), Mathew Barzal (575 minutes) and Emil Heineman (475 minutes).
Power-play points: 18 last season, 25 projected.
| Last season | Q1 | Q2 | Q3 | Q4 |
|---|---|---|---|---|
| Games | 20 | 21 | 21 | 20 |
| Points | 15 | 11 | 18 | 15 |
| Per game | 0.75 | 0.52 | 0.86 | 0.75 |
| Ice time | 22:30 | 25:12 | 24:37 | 26:25 |
Out of the room: Anders Lee (42 points, 8 of them on the power play, 1.8 power-play minutes a night) has gone to UTA. Also gone: Maxim Shabanov (18p, 1.6 PP minutes).
12. J.T. Miller, NYR
0.78 points a game last season, 0.91 projected: a gain of +0.14. In totals that is 53 in 68 games to 69 in 75: +16 points, +10 of it from the rate and +5 from the change in games played.
The depth chart has him second-line centre, the first power-play unit and the penalty kill. His projected linemates are Will Cuylle and Gabe Perreault. The rest of that unit is Mika Zibanejad, Adam Fox, Pavel Dorofeyev and Alexis Lafrenière.
He played 20:09 a night last season, 15:11 at even strength and 3:08 on the power play, and his most common even-strength partners were Vladislav Gavrikov (497 minutes), Conor Sheary (362 minutes) and Mika Zibanejad (342 minutes).
Power-play points: 19 last season, 24 projected.
| Last season | Q1 | Q2 | Q3 | Q4 |
|---|---|---|---|---|
| Games | 17 | 17 | 17 | 17 |
| Points | 8 | 13 | 17 | 15 |
| Per game | 0.47 | 0.76 | 1.00 | 0.88 |
| Ice time | 20:42 | 20:57 | 20:18 | 18:38 |
Out of the room: Vincent Trocheck (53 points, 16 of them on the power play, 3.1 power-play minutes a night) has gone to UTA.
13. Mitch Marner, VGK
0.99 points a game last season, 1.12 projected: a gain of +0.13. In totals that is 80 in 81 games to 88 in 79: +8 points, +10 of it from the rate and -2 from the change in games played.
The depth chart has him second-line right wing, the first power-play unit and the penalty kill. His projected linemates are William Karlsson and Brett Howden. The rest of that unit is Mark Stone, Tomas Hertl, Shea Theodore and Jack Eichel.
He played 19:58 a night last season, 15:07 at even strength and 3:36 on the power play, and his most common even-strength partners were Pavel Dorofeyev (619 minutes), Noah Hanifin (388 minutes) and Shea Theodore (380 minutes).
Power-play points: 24 last season, 28 projected.
| Last season | Q1 | Q2 | Q3 | Q4 |
|---|---|---|---|---|
| Games | 20 | 20 | 21 | 20 |
| Points | 21 | 19 | 22 | 18 |
| Per game | 1.05 | 0.95 | 1.05 | 0.90 |
| Ice time | 20:44 | 19:39 | 19:34 | 19:54 |
Out of the room: Pavel Dorofeyev (64 points, 30 of them on the power play, 3.4 power-play minutes a night) has gone to NYR. Also gone: Reilly Smith (26p, 0.4 PP minutes).
14. Jack Hughes, NJD
1.26 points a game last season, 1.38 projected: a gain of +0.12. In totals that is 77 in 61 games to 98 in 71: +21 points, +8 of it from the rate and +13 from the change in games played.
The depth chart has him first-line centre and the first power-play unit. His projected linemates are Anthony Mantha and Jesper Bratt. The unit adds Nico Hischier and Luke Hughes, with Anthony Mantha and Jesper Bratt carried over from his line.
He played 21:19 a night last season, 17:58 at even strength and 2:57 on the power play, and his most common even-strength partners were Jesper Bratt (708 minutes), Connor Brown (368 minutes) and Luke Hughes (360 minutes).
Power-play points: 23 last season, 32 projected.
| Last season | Q1 | Q2 | Q3 | Q4 |
|---|---|---|---|---|
| Games | 15 | 15 | 16 | 15 |
| Points | 18 | 12 | 21 | 26 |
| Per game | 1.20 | 0.80 | 1.31 | 1.73 |
| Ice time | 20:48 | 22:07 | 20:11 | 22:14 |
Out of the room: Simon Nemec (26 points, 2 of them on the power play, 1.2 power-play minutes a night) has gone to CGY.
15. Lane Hutson, MTL
0.95 points a game last season, 1.07 projected: a gain of +0.12. In totals that is 78 in 82 games to 86 in 81: +8 points, +9 of it from the rate and -1 from the change in games played.
The depth chart has him first pair on the left side and the first power-play unit. His projected partner is Alexandre Carrier. The rest of that unit is Nick Suzuki, Cole Caufield, Juraj Slafkovský and Ivan Demidov.
He played 23:46 a night last season, 20:00 at even strength and 3:18 on the power play, and his most common even-strength partners were Nick Suzuki (549 minutes), Juraj Slafkovský (508 minutes) and Cole Caufield (492 minutes).
Power-play points: 20 last season, 26 projected.
| Last season | Q1 | Q2 | Q3 | Q4 |
|---|---|---|---|---|
| Games | 20 | 21 | 21 | 20 |
| Points | 17 | 23 | 24 | 14 |
| Per game | 0.85 | 1.10 | 1.14 | 0.70 |
| Ice time | 22:56 | 24:26 | 23:39 | 24:03 |
Out of the room: Brendan Gallagher (23 points, 5 of them on the power play, 1.4 power-play minutes a night) has gone to VAN.
16. Luke Hughes, NJD
0.51 points a game last season, 0.63 projected: a gain of +0.11. In totals that is 35 in 68 games to 48 in 76: +13 points, +9 of it from the rate and +4 from the change in games played.
The depth chart has him first pair on the left side and the first power-play unit. His projected partner is Brett Pesce. The rest of that unit is Anthony Mantha, Jesper Bratt, Nico Hischier and Jack Hughes.
He played 23:01 a night last season, 19:44 at even strength and 2:01 on the power play, and his most common even-strength partners were Nico Hischier (446 minutes), Jesper Bratt (409 minutes) and Timo Meier (389 minutes).
Power-play points: 13 last season, 17 projected.
| Last season | Q1 | Q2 | Q3 | Q4 |
|---|---|---|---|---|
| Games | 17 | 17 | 17 | 17 |
| Points | 9 | 9 | 9 | 8 |
| Per game | 0.53 | 0.53 | 0.53 | 0.47 |
| Ice time | 22:56 | 23:52 | 22:13 | 23:02 |
Out of the room: Simon Nemec (26 points, 2 of them on the power play, 1.2 power-play minutes a night) has gone to CGY.
17. William Eklund, OTT
0.68 points a game last season, 0.79 projected: a gain of +0.11. In totals that is 53 in 78 games to 63 in 79: +10 points, +9 of it from the rate and +1 from the change in games played.
The depth chart has him first-line centre and the first power-play unit. His projected linemates are Drake Batherson and Tim Stützle. The unit adds Dylan Cozens and Jake Sanderson, with Drake Batherson and Tim Stützle carried over from his line.
He played 18:32 a night last season, 15:13 at even strength and 2:54 on the power play, and his most common even-strength partners were Alexander Wennberg (630 minutes), Mario Ferraro (429 minutes) and Dmitry Orlov (413 minutes).
Power-play points: 16 last season, 19 projected.
| Last season | Q1 | Q2 | Q3 | Q4 |
|---|---|---|---|---|
| Games | 20 | 19 | 19 | 20 |
| Points | 14 | 14 | 10 | 15 |
| Per game | 0.70 | 0.74 | 0.53 | 0.75 |
| Ice time | 19:56 | 19:44 | 17:29 | 17:01 |
Out of the room: Brady Tkachuk (59 points, 20 of them on the power play, 3.3 power-play minutes a night) has gone to FLA.
18. Leo Carlsson, ANA
0.96 points a game last season, 1.07 projected: a gain of +0.11. In totals that is 67 in 70 games to 79 in 74: +12 points, +8 of it from the rate and +4 from the change in games played.
The depth chart has him first-line centre and the first power-play unit. His projected linemates are Chris Kreider and Cutter Gauthier. The unit adds Mikael Granlund, Jackson LaCombe and Beckett Sennecke, with Cutter Gauthier carried over from his line.
He played 19:09 a night last season, 14:48 at even strength and 3:28 on the power play, and his most common even-strength partners were Chris Kreider (574 minutes), Troy Terry (518 minutes) and Jackson LaCombe (407 minutes).
Power-play points: 18 last season, 19 projected.
| Last season | Q1 | Q2 | Q3 | Q4 |
|---|---|---|---|---|
| Games | 18 | 17 | 17 | 18 |
| Points | 26 | 15 | 11 | 15 |
| Per game | 1.44 | 0.88 | 0.65 | 0.83 |
| Ice time | 19:18 | 20:34 | 17:55 | 18:50 |
Out of the room: John Carlson (60 points, 14 of them on the power play, 2.7 power-play minutes a night) has gone to TBL. Also gone: Mason McTavish (41p, 2.0 PP minutes) and Jacob Trouba (35p, 0.7 PP minutes).
19. Connor Bedard, CHI
1.09 points a game last season, 1.20 projected: a gain of +0.11. In totals that is 75 in 69 games to 73 in 61: -2 points, +7 of it from the rate and -9 from the change in games played.
Note the sign: he is projected to be better per game and to score fewer points, because the model has him down 8 games on last season. Our records have him out with a shoulder injury: "Shoulder: Expected to be out until at least Nov 11", and the games projection already carries that. A rate list will do this, and it is the reason the Points column sits beside the Gain column rather than instead of it.
The depth chart has him no depth-chart slot on file.
He played 20:52 a night last season, 17:21 at even strength and 3:30 on the power play, and his most common even-strength partners were Andre Burakovsky (584 minutes), Ryan Greene (561 minutes) and Wyatt Kaiser (402 minutes).
Power-play points: 21 last season, 24 projected.
| Last season | Q1 | Q2 | Q3 | Q4 |
|---|---|---|---|---|
| Games | 17 | 17 | 18 | 17 |
| Points | 26 | 20 | 16 | 13 |
| Per game | 1.53 | 1.18 | 0.89 | 0.76 |
| Ice time | 21:11 | 20:45 | 20:57 | 20:34 |
Out of the room: Andre Burakovsky (33 points, 10 of them on the power play, 2.2 power-play minutes a night) has gone to OTT. Also gone: Ilya Mikheyev (36p, 0.1 PP minutes) and Louis Crevier (25p, 0.1 PP minutes).
20. Macklin Celebrini, SJS
1.40 points a game last season, 1.51 projected: a gain of +0.11. In totals that is 115 in 82 games to 120 in 79: +4 points, +9 of it from the rate and -4 from the change in games played.
The depth chart has him first-line right wing and the first power-play unit. His projected linemates are Will Smith and Igor Chernyshov. The unit adds Dmitry Orlov, Tyler Toffoli and Alexander Wennberg, with Will Smith carried over from his line.
He played 21:19 a night last season, 17:28 at even strength and 3:40 on the power play, and his most common even-strength partners were Will Smith (860 minutes), Dmitry Orlov (579 minutes) and John Klingberg (426 minutes).
Power-play points: 33 last season, 37 projected.
| Last season | Q1 | Q2 | Q3 | Q4 |
|---|---|---|---|---|
| Games | 20 | 21 | 21 | 20 |
| Points | 30 | 33 | 27 | 25 |
| Per game | 1.50 | 1.57 | 1.29 | 1.25 |
| Ice time | 20:31 | 20:44 | 22:39 | 21:20 |
Out of the room: William Eklund (53 points, 16 of them on the power play, 2.9 power-play minutes a night) has gone to OTT. Also gone: John Klingberg (27p, 3.0 PP minutes) and Philipp Kurashev (20p, 1.8 PP minutes).
What the quarters are worth
Short answer: as a description of last season, a lot. As a prediction of this one, nothing, and we can show our working.
The question cannot be asked as "does a hot finish predict next season", because a hot finish is part of the season and the season predicts next year all by itself. The real question is whether the last quarter adds anything beyond the full-season figure, which means a partial correlation holding the full season constant. Measured across 188,890 skater game logs and four seasons:
| What carries from a strong finish | Partial correlation |
|---|---|
| Points per 60 late, into next season's points | +0.02 to +0.04 |
| Ice time late, into next season's ice time | +0.142 |
| Ice time late, into next season's points | -0.028 |
The middle row is the only one with a pulse, and it is about minutes rather than production. A player who gains two minutes a night over the last quarter keeps a median of half a minute of it into the following season; one who loses two minutes gives up more than a minute. Real in minutes, invisible in points, worth one or two points a year, which is under the noise on every number above. On peripherals the full-season rate beat the late-season rate in nine comparisons out of nine.
So the quarterly tables above are there to be looked at, not to be added up. A collapsing ice-time line, as opposed to a collapsing points line, is the one pattern in them that carries into next year, and even then it carries into next year's minutes rather than next year's scoring. Our projection has no within-season recency term for exactly this reason. Recency operates across seasons, not inside one.
Where this list is most likely to be wrong
The depth chart is doing a lot of the work. Line and power-play slots come from our projected lines, which are our reading of camp and last season, not a promise from a coach. Most of the movement in a per-game rate is a movement in role, so two men separated by five hundredths of a point here are often separated by nothing more than which of them is drawn onto the first unit. If you disagree with a club's depth chart you disagree with the projection, and that is usually the more productive argument.
A rising rate is not a promise of points. Ranking on per game deliberately throws away availability, which means it also throws away a genuine risk. Read the Points column beside the Gain column before you draft anybody: a man who improves by 0.23 a game and misses twenty of them has helped you less than the projection's rate suggests, and the games figure beside him is itself a model output that will be wrong for somebody on this page.
Small denominators are where a rate list goes wrong, which is what the gate is for. Forty games last season is the floor, and it is stated above along with the names it removes. Rookies are excluded as well, since there is no previous rate to improve on. Both groups contain players who will score more than anybody here.
Nothing on this page knows about the summer's business after our last data refresh. Departures are computed by comparing last season's club to the club we currently project a player on. A signing we have not ingested will read as a vacancy that is already filled.
Projections are for the 2026-27 season, 84 games. Points per game is points divided by games played, not by games the club played. Last season's totals, power-play points and games are regular season only. Ice time and even-strength linemate minutes are measured from our own shift and on-ice records for 2025-26. Line and power-play slots are our projected depth chart. Quarterly splits divide each player's own games into four equal blocks in date order. The late-season form measurements are in the projection methodology document.