
Blocks, Hits and Draws: Who Actually Supplies Them in 2026-27
Goals and assists show up on every ranking list. These are the players who win everything else: blocks, hits, faceoffs, shots. What they're projected for, and which of them you can wait five rounds to take.
Every table below is also on the live position analysis page, where any two categories cross into a grid and every cell opens the players it counted.
The defencemen who block and quarterback
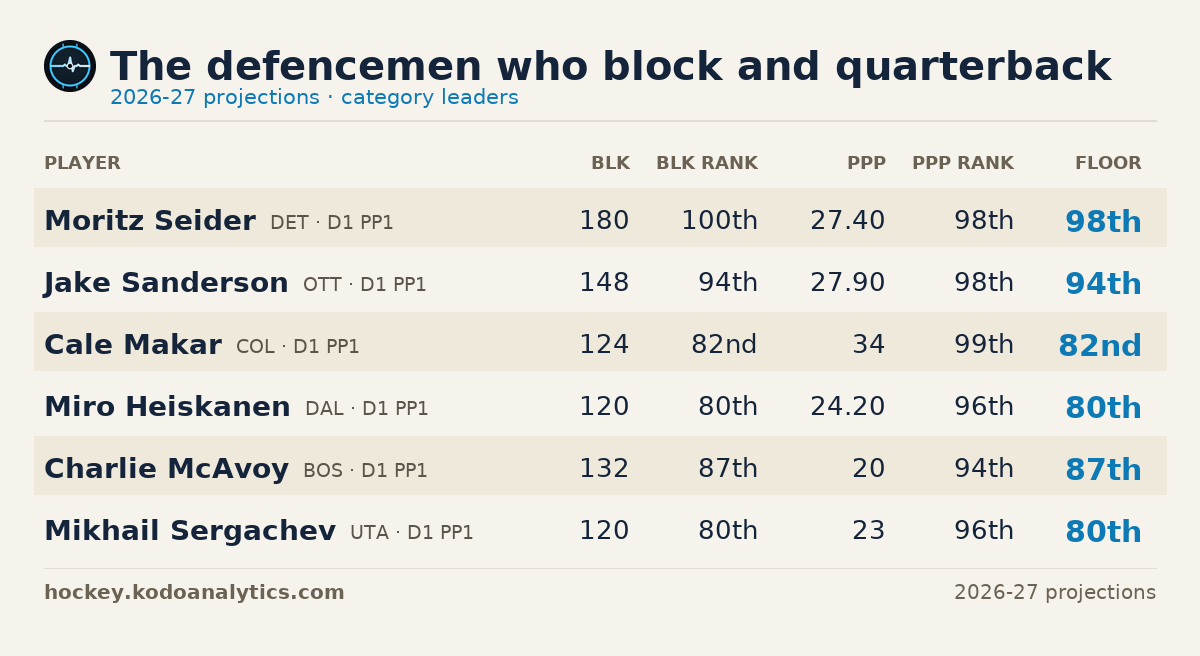
Moritz Seider is projected for 180 blocks and 27.4 power-play points, on D1 PP1, alongside Simon Edvinsson. Nobody argues that defencemen block shots. The useful question is which of them also run a power play, because that is the pair of columns almost nobody supplies at once: 6 defencemen clear 120 blocks and 20 power-play points together.
ADDING THE TWO WOULD BE MEANINGLESS, so the table does not. One block is not worth one power-play point in any scoring system, and a sum ranked pure shot-blockers over men who genuinely do both. Each column is shown as a percentile against other defencemen instead, and the men are ordered by the WEAKER of their two: being good at both is a floor, not an average.
The unit is the thing to check before drafting any of them. Moritz Seider sits at 99.8 for blocks and 97.9 for power play; the blocks are the safe half, because a coach rarely takes shot-blocking away while power-play time can move in a week and takes most of a man's value with it.
| Player | Tm | Role | BLK | BLK RANK | PPP | PPP RANK | FLOOR |
|---|---|---|---|---|---|---|---|
| Moritz Seider | DET | D1 PP1 | 180 | 100th | 27.4 | 98th | 98th |
| Jake Sanderson | OTT | D1 PP1 | 148 | 94th | 27.9 | 98th | 94th |
| Cale Makar | COL | D1 PP1 | 124 | 82nd | 34 | 99th | 82nd |
| Miro Heiskanen | DAL | D1 PP1 | 120 | 80th | 24.2 | 96th | 80th |
| Charlie McAvoy | BOS | D1 PP1 | 132 | 87th | 20 | 94th | 87th |
| Mikhail Sergachev | UTA | D1 PP1 | 120 | 80th | 23 | 96th | 80th |
The forwards who block
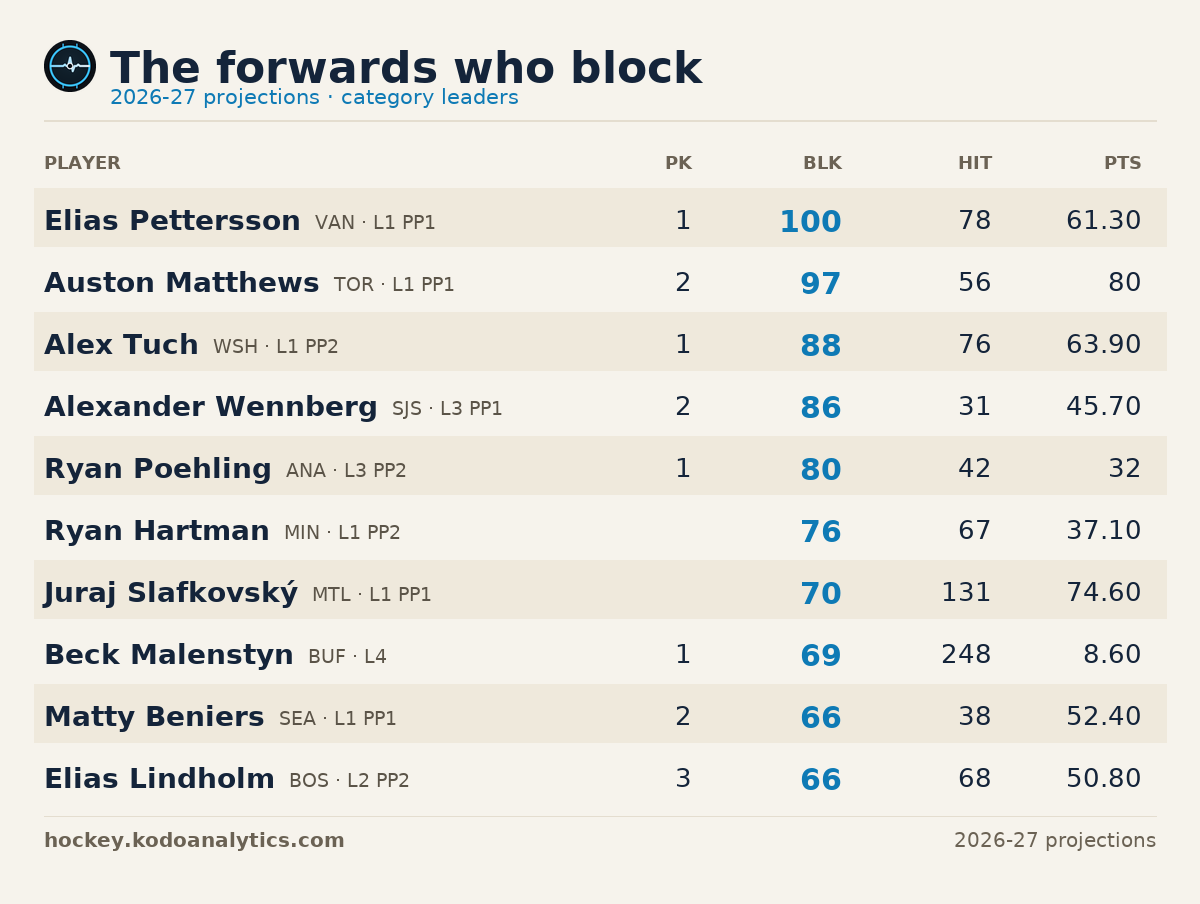
This is the list worth knowing, because it is the one nobody drafts for. Elias Pettersson is projected for 100 blocks, and he is the only forward in the league who reaches 100. In a league that counts blocks he is doing a slice of a defenceman's job out of a forward slot, at a forward's price.
8 of these 10 kill penalties, which is where a forward's blocks mostly come from. That makes the category more fragile for them than for a defenceman: lose the kill, lose most of the number.
| Player | Tm | Role | PK | BLK | HIT | PTS |
|---|---|---|---|---|---|---|
| Elias Pettersson | VAN | L1 PP1 | 1 | 100 | 78 | 61.3 |
| Auston Matthews | TOR | L1 PP1 | 2 | 97 | 56 | 80 |
| Alex Tuch | WSH | L1 PP2 | 1 | 88 | 76 | 63.9 |
| Alexander Wennberg | SJS | L3 PP1 | 2 | 86 | 31 | 45.7 |
| Ryan Poehling | ANA | L3 PP2 | 1 | 80 | 42 | 32 |
| Ryan Hartman | MIN | L1 PP2 | 76 | 67 | 37.1 | |
| Juraj Slafkovský | MTL | L1 PP1 | 70 | 131 | 74.6 | |
| Beck Malenstyn | BUF | L4 | 1 | 69 | 248 | 8.6 |
| Matty Beniers | SEA | L1 PP1 | 2 | 66 | 38 | 52.4 |
| Elias Lindholm | BOS | L2 PP2 | 3 | 66 | 68 | 50.8 |
The defencemen who hit
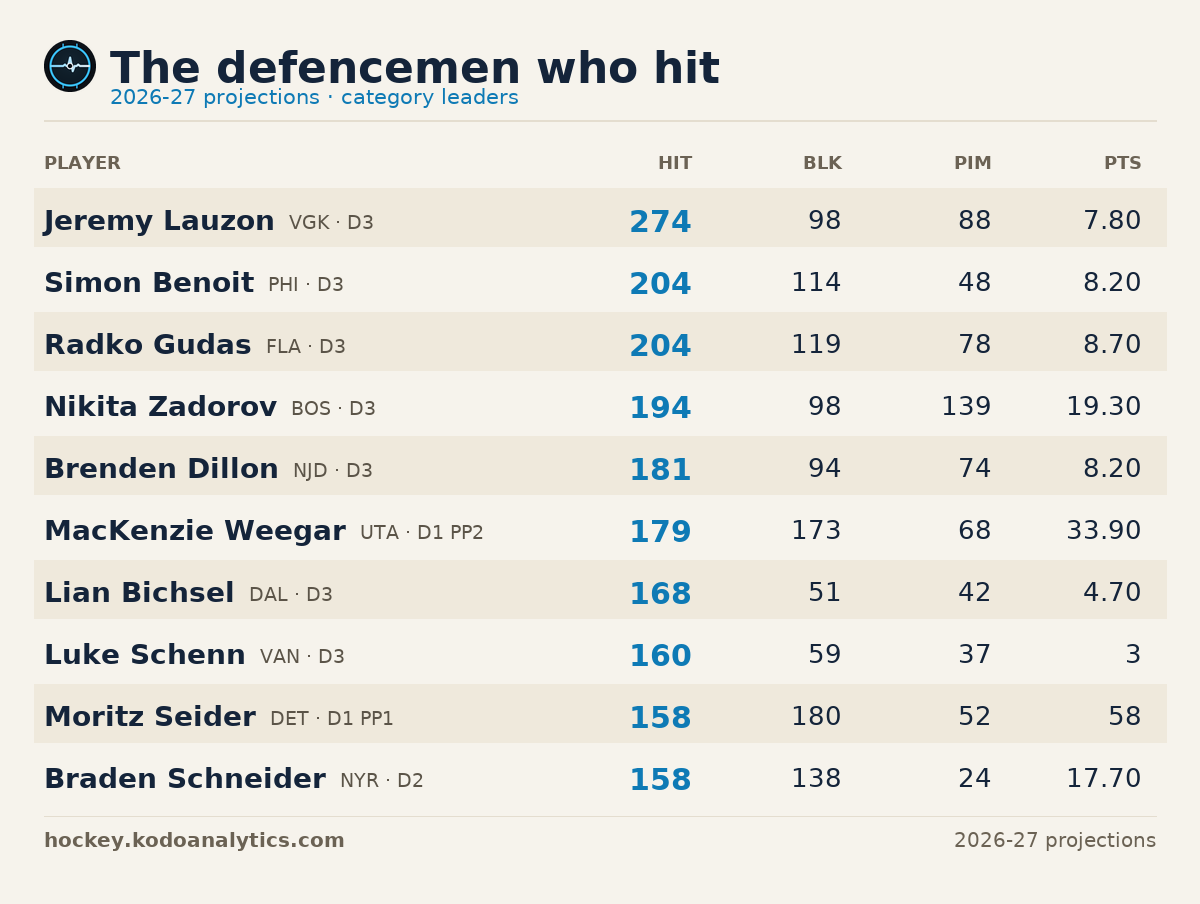
Jeremy Lauzon projects 274 hits and 98 blocks, on D3, alongside Parker Wotherspoon. Hits are the category where the blue line and the forward group actually compete, and these are the men who win it from defence while the blocks come along free.
Read the points column before reaching. Most of this list scores little, so they are worth a pick only in a league deep enough that hits and blocks are real categories rather than tiebreakers.
| Player | Tm | Role | HIT | BLK | PIM | PTS |
|---|---|---|---|---|---|---|
| Jeremy Lauzon | VGK | D3 | 274 | 98 | 88 | 7.8 |
| Simon Benoit | PHI | D3 | 204 | 114 | 48 | 8.2 |
| Radko Gudas | FLA | D3 | 204 | 119 | 78 | 8.7 |
| Nikita Zadorov | BOS | D3 | 194 | 98 | 139 | 19.3 |
| Brenden Dillon | NJD | D3 | 181 | 94 | 74 | 8.2 |
| MacKenzie Weegar | UTA | D1 PP2 | 179 | 173 | 68 | 33.9 |
| Lian Bichsel | DAL | D3 | 168 | 51 | 42 | 4.7 |
| Luke Schenn | VAN | D3 | 160 | 59 | 37 | 3 |
| Moritz Seider | DET | D1 PP1 | 158 | 180 | 52 | 58 |
| Braden Schneider | NYR | D2 | 158 | 138 | 24 | 17.7 |
The faceoff engines
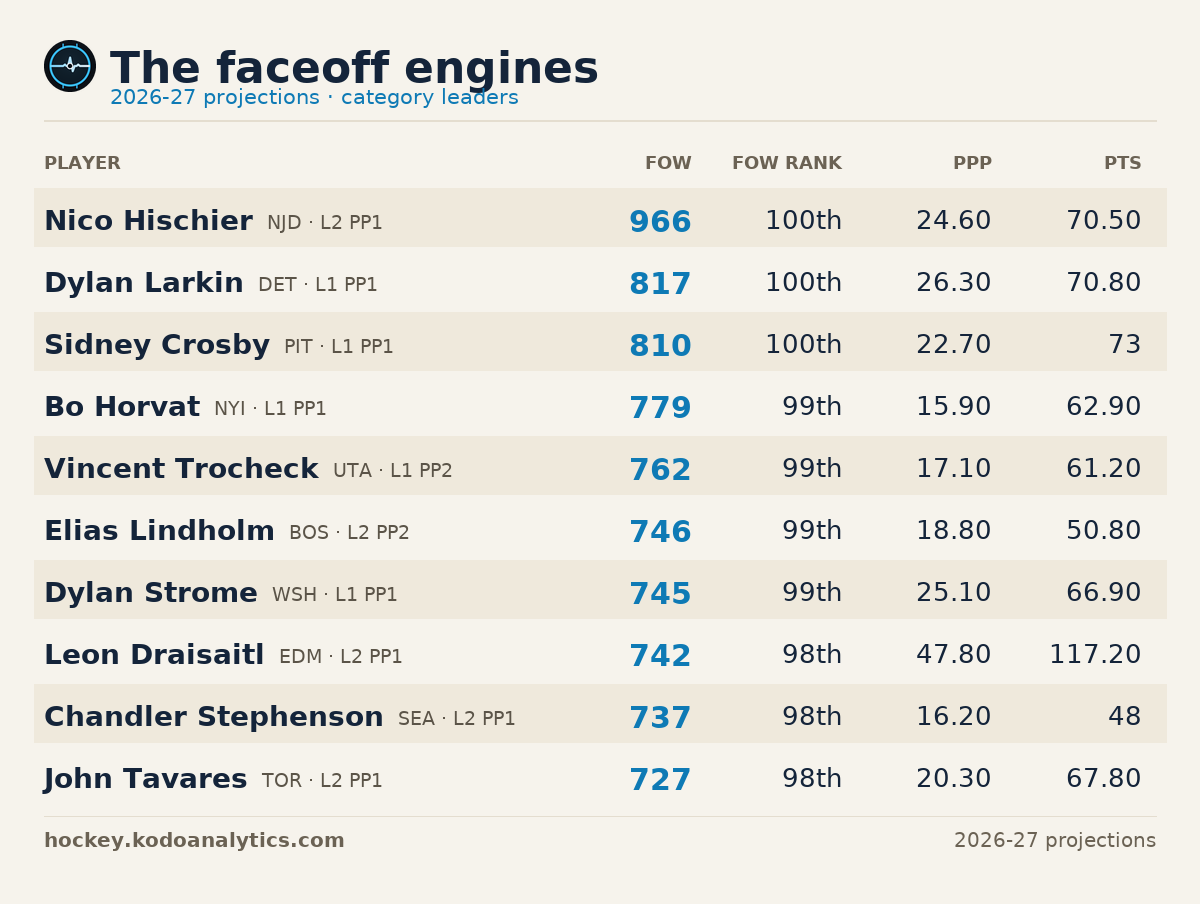
Nico Hischier projects 966 faceoff wins, more than any skater in the league, from L2 PP1, alongside Dawson Mercer and Timo Meier. Draws go to the man taking them and nobody else, which makes this the most concentrated category in the game: a second-line centre out-earns a first-line winger with twice his points, every night, without either of them playing differently.
Defencemen are absent because they take no draws at all. If your league counts faceoffs, these names are worth more than their point totals say, and they are the cheapest edge on this page.
| Player | Tm | Role | FOW | FOW RANK | PPP | PTS |
|---|---|---|---|---|---|---|
| Nico Hischier | NJD | L2 PP1 | 966 | 100th | 24.6 | 70.5 |
| Dylan Larkin | DET | L1 PP1 | 817 | 100th | 26.3 | 70.8 |
| Sidney Crosby | PIT | L1 PP1 | 810 | 100th | 22.7 | 73 |
| Bo Horvat | NYI | L1 PP1 | 779 | 99th | 15.9 | 62.9 |
| Vincent Trocheck | UTA | L1 PP2 | 762 | 99th | 17.1 | 61.2 |
| Elias Lindholm | BOS | L2 PP2 | 746 | 99th | 18.8 | 50.8 |
| Dylan Strome | WSH | L1 PP1 | 745 | 99th | 25.1 | 66.9 |
| Leon Draisaitl | EDM | L2 PP1 | 742 | 98th | 47.8 | 117.2 |
| Chandler Stephenson | SEA | L2 PP1 | 737 | 98th | 16.2 | 48 |
| John Tavares | TOR | L2 PP1 | 727 | 98th | 20.3 | 67.8 |
Everything but the goals
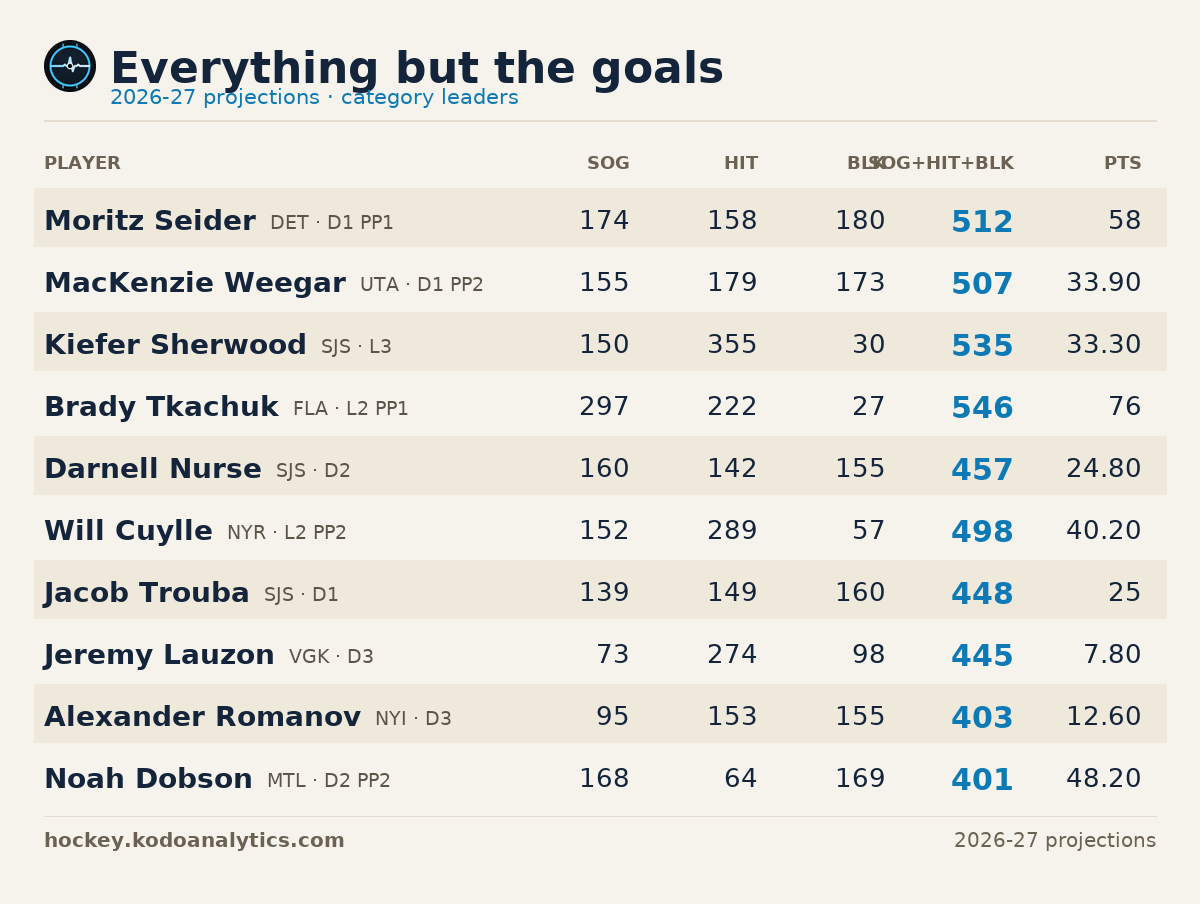
Shots, hits and blocks added together is the whole of what a skater contributes when he is not scoring, and most category leagues count all three. Moritz Seider leads at 512 from D1 PP1.
The leader at each position is the useful part of this list: Auston Matthews at centre (443), Kiefer Sherwood at left wing (535), Alex Laferriere at right wing (454), Moritz Seider at defence (512).
| Player | Tm | Role | SOG | HIT | BLK | SOG+HIT+BLK | PTS |
|---|---|---|---|---|---|---|---|
| Moritz Seider | DET | D1 PP1 | 174 | 158 | 180 | 512 | 58 |
| MacKenzie Weegar | UTA | D1 PP2 | 155 | 179 | 173 | 507 | 33.9 |
| Kiefer Sherwood | SJS | L3 | 150 | 355 | 30 | 535 | 33.3 |
| Brady Tkachuk | FLA | L2 PP1 | 297 | 222 | 27 | 546 | 76 |
| Darnell Nurse | SJS | D2 | 160 | 142 | 155 | 457 | 24.8 |
| Will Cuylle | NYR | L2 PP2 | 152 | 289 | 57 | 498 | 40.2 |
| Jacob Trouba | SJS | D1 | 139 | 149 | 160 | 448 | 25 |
| Jeremy Lauzon | VGK | D3 | 73 | 274 | 98 | 445 | 7.8 |
| Alexander Romanov | NYI | D3 | 95 | 153 | 155 | 403 | 12.6 |
| Noah Dobson | MTL | D2 PP2 | 168 | 64 | 169 | 401 | 48.2 |
| Auston Matthews | TOR | L1 PP1 | 290 | 56 | 97 | 443 | 80 |
| Alex Laferriere | LAK | L2 PP2 | 201 | 208 | 45 | 454 | 45.2 |
Weighting the three, and why it changes the list
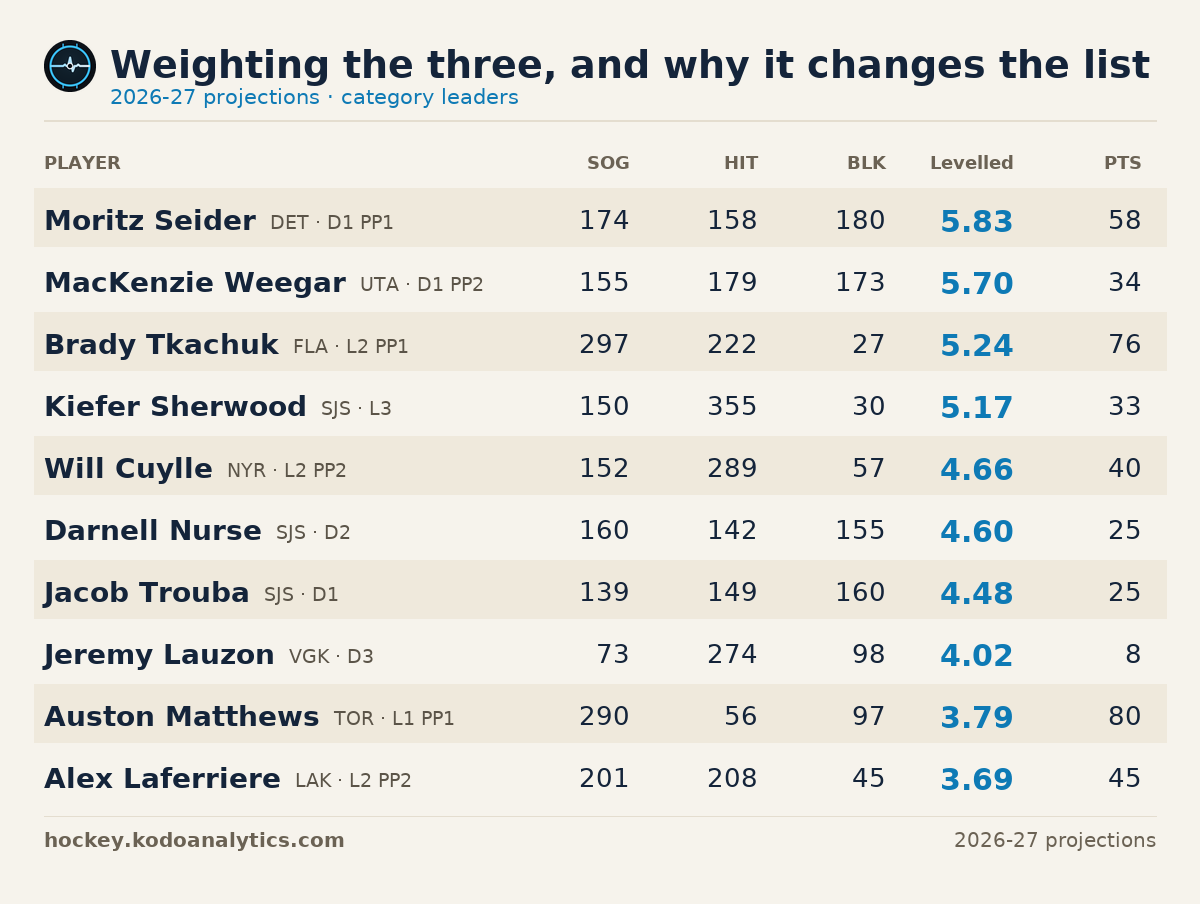
The list above adds the three together, which quietly makes it a shots list. Across the skaters on a depth chart they average about 117 shots, 78 hits and 58 blocks, so the biggest column does most of the talking and blocks, the scarcest of the three, does the least.
Giving each of the three the same say instead moves the men who supply one category in volume rather than three in moderation. Chris Tanev is 426 on the added number and 316 once the three are levelled, off 138 blocks, alongside Morgan Rielly.
It moves the shot-volume forwards the other way. Alex Ovechkin goes 143 to 201: 181 shots is a real category and it is one category, not three.
Which version to use is a question about your league rather than about hockey. A league that scores all three equally wants the levelled list. One that pays more for a shot than a block wants its own weights, and the gap between the two lists is the size of that decision.
| Player | Tm | Role | SOG | HIT | BLK | Levelled | PTS |
|---|---|---|---|---|---|---|---|
| Moritz Seider | DET | D1 PP1 | 174 | 158 | 180 | 5.83 | 58 |
| MacKenzie Weegar | UTA | D1 PP2 | 155 | 179 | 173 | 5.7 | 34 |
| Brady Tkachuk | FLA | L2 PP1 | 297 | 222 | 27 | 5.24 | 76 |
| Kiefer Sherwood | SJS | L3 | 150 | 355 | 30 | 5.17 | 33 |
| Will Cuylle | NYR | L2 PP2 | 152 | 289 | 57 | 4.66 | 40 |
| Darnell Nurse | SJS | D2 | 160 | 142 | 155 | 4.6 | 25 |
| Jacob Trouba | SJS | D1 | 139 | 149 | 160 | 4.48 | 25 |
| Jeremy Lauzon | VGK | D3 | 73 | 274 | 98 | 4.02 | 8 |
| Auston Matthews | TOR | L1 PP1 | 290 | 56 | 97 | 3.79 | 80 |
| Alex Laferriere | LAK | L2 PP2 | 201 | 208 | 45 | 3.69 | 45 |
| Alexander Romanov | NYI | D3 | 95 | 153 | 155 | 3.62 | 13 |
| Noah Dobson | MTL | D2 PP2 | 168 | 64 | 169 | 3.62 | 48 |
The same categories, several rounds later
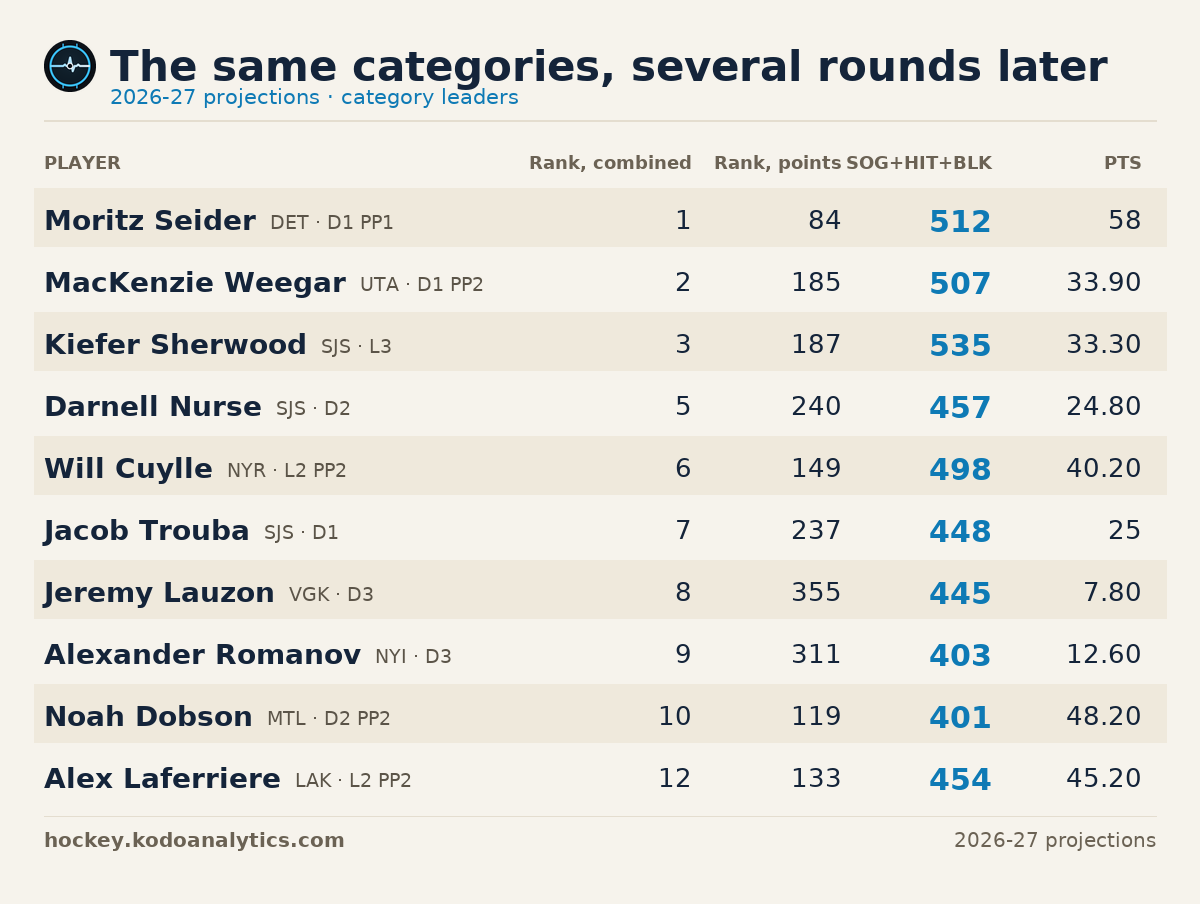
This is the list that decides a category league. Each man below is top sixty in shots, hits and blocks combined, and nowhere near that in points, which means the categories can be bought without spending an early pick on them.
Moritz Seider is 1 in the league on the combined number and 84 in points. You are not drafting him to score. You are drafting him so that the picks you spend on scoring do not also have to cover three other columns.
| Player | Tm | Role | Rank, combined | Rank, points | SOG+HIT+BLK | PTS |
|---|---|---|---|---|---|---|
| Moritz Seider | DET | D1 PP1 | 1 | 84 | 512 | 58 |
| MacKenzie Weegar | UTA | D1 PP2 | 2 | 185 | 507 | 33.9 |
| Kiefer Sherwood | SJS | L3 | 3 | 187 | 535 | 33.3 |
| Darnell Nurse | SJS | D2 | 5 | 240 | 457 | 24.8 |
| Will Cuylle | NYR | L2 PP2 | 6 | 149 | 498 | 40.2 |
| Jacob Trouba | SJS | D1 | 7 | 237 | 448 | 25 |
| Jeremy Lauzon | VGK | D3 | 8 | 355 | 445 | 7.8 |
| Alexander Romanov | NYI | D3 | 9 | 311 | 403 | 12.6 |
| Noah Dobson | MTL | D2 PP2 | 10 | 119 | 401 | 48.2 |
| Alex Laferriere | LAK | L2 PP2 | 12 | 133 | 454 | 45.2 |
| Braden Schneider | NYR | D2 | 13 | 276 | 396 | 17.7 |
| Radko Gudas | FLA | D3 | 15 | 341 | 394 | 8.7 |
How to use it
Link your league and every count on the position page re-scores for the columns you actually play. Any two categories cross into a grid, a plus sums them into one, and every cell opens the exact players behind it with the line and power-play unit each projection is built on.
The number to act on is how many suppliers a category has, not who tops it. A column with fifty suppliers can wait until the back half of your draft. A column with five cannot.